Adding an OPNsense Firewall to My Homelab (and Sending Logs to Wazuh)
Note: This setup was originally built on Unraid, I’ve since migrated my homelab to Proxmox, but the concepts still apply.
Why I Added a Firewall to My Homelab
My homelab had already grown into a pretty capable security environment:
- Unraid server hosting containers and VMs
- Wazuh SIEM running on a Raspberry Pi
- multiple Windows and Linux test machines
- attack simulation tools like Nmap and Hydra
But something was missing.
I didn’t have network visibility.
Endpoint logs are useful, but a firewall shows an entirely different side of the story:
- who is scanning your network
- what ports attackers are targeting
- what traffic is being blocked
- suspicious outbound connections
So I decided to add a dedicated firewall to the lab and feed its logs directly into my SIEM.
Installing OPNsense on Unraid
I deployed OPNsense as a virtual machine inside Unraid.
First I downloaded the OPNsense installer ISO from the official site.
Then I created a new VM in the Unraid VM manager.
Important configuration:
- Machine Type: Q35
- CPU Mode: Host passthrough
- Network: bridged adapter
- Disk Bus: VirtIO
- Boot ISO: OPNsense installer
Once the VM booted, the installer walked through the typical steps:
- disk partitioning
- root password setup
- network interface assignment
After installation completed, I removed the ISO and rebooted the VM.
Now the firewall was running.
My First Mistake
My first mistake was not assigning the interfaces correctly.
OPNsense requires two interfaces:
- WAN
- LAN
Initially I accidentally assigned them backwards.
This caused a bunch of confusing issues:
- the firewall couldn’t reach the internet
- DHCP wasn’t working
- machines couldn’t route traffic
Once I swapped the interfaces correctly, everything started working.
Setting Up Basic Firewall Rules
After getting the firewall running, I started configuring rules.
The goal was simple:
- allow internal lab traffic
- block unnecessary external connections
- generate useful logs
Every firewall rule had logging enabled so the SIEM could capture the events.
This is important because without logging, blocked traffic never shows up in the monitoring system.
Connecting the Firewall to My SIEM
Once the firewall was working, I wanted to send the logs into Wazuh.
The pipeline ended up looking like this:
OPNsense > Syslog > Wazuh Manager > Wazuh Indexer > Wazuh Dashboard
Configuring OPNsense Syslog
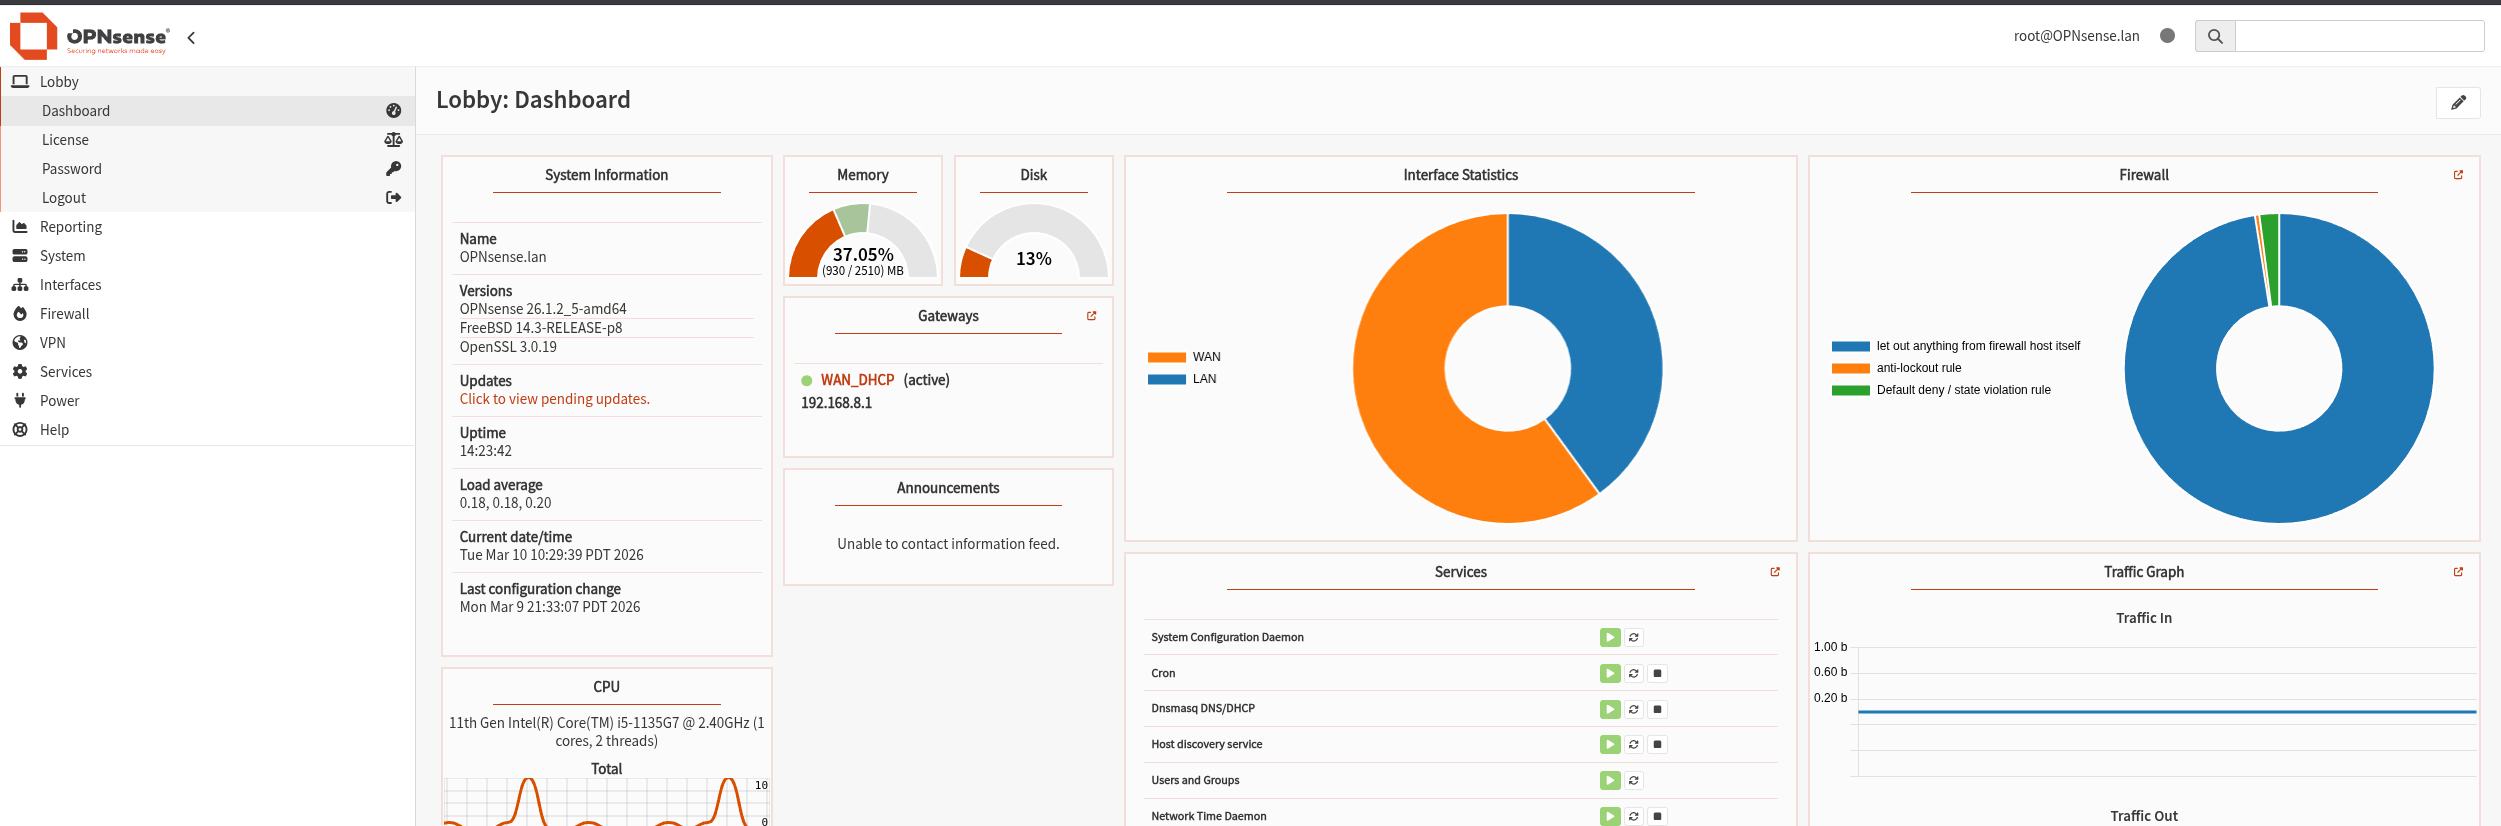
Inside the OPNsense dashboard I enabled remote logging.
Settings I used:
- Target server: Wazuh manager IP
- Transport: UDP
- Port: 514
- Log type: Firewall
- Program:
filterlog
That filterlog field matters because it’s what OPNsense uses for firewall events.
A typical firewall log looks like this:
1
OPNsense.lan filterlog[98982]: ...,match,block,in,...
Verifying Logs Were Arriving
Before worrying about the dashboard, I wanted proof the logs were actually reaching the Wazuh manager.
I used tcpdump to watch the syslog port.
1
sudo tcpdump -i any port 514
Immediately I could see OPNsense sending logs.
That confirmed the first part of the pipeline worked.
Another Problem
When I opened the Wazuh dashboard, the logs were there but they weren’t triggering alerts.
Searching worked:
1
predecoder.program_name:filterlog
But I wanted actual detection rules for blocked traffic.
Creating a Custom Detection Rule
At first I tried building a completely custom decoder and rule.
The Wazuh web editor kept throwing XML syntax errors even though the XML looked correct.
After fighting with the UI for a while, I switched to editing the files directly on the Wazuh manager.
That ended up being much easier.
Decoder file:
1
/var/ossec/etc/decoders/opnsense_decoders.xml
1
2
3
<decoder name="opnsense-filterlog">
  <prematch>filterlog</prematch>
</decoder>
Discovering Wazuh Having Detection Events
While testing rules I noticed something interesting.
Wazuh was already detecting the firewall logs using its built-in pfSense ruleset.
Example alert:
1
2
rule.id: 87702
description: Multiple pfSense firewall blocks events from same source
Instead of replacing that rule, I decided to build on top of it.
Final Rule That Worked
This was the final rule.
Rule file:
1
/var/ossec/etc/rules/opnsense_rules.xml
1
2
3
4
5
6
7
8
9
<group name="opnsense,firewall,local">

  <rule id="100102" level="7">
    <if_sid>87702</if_sid>
    <description>OPNsense firewall blocked traffic</description>
    <group>opnsense,firewall,block</group>
  </rule>

</group>
After saving the rule I restarted Wazuh.
1
sudo systemctl restart wazuh-manager
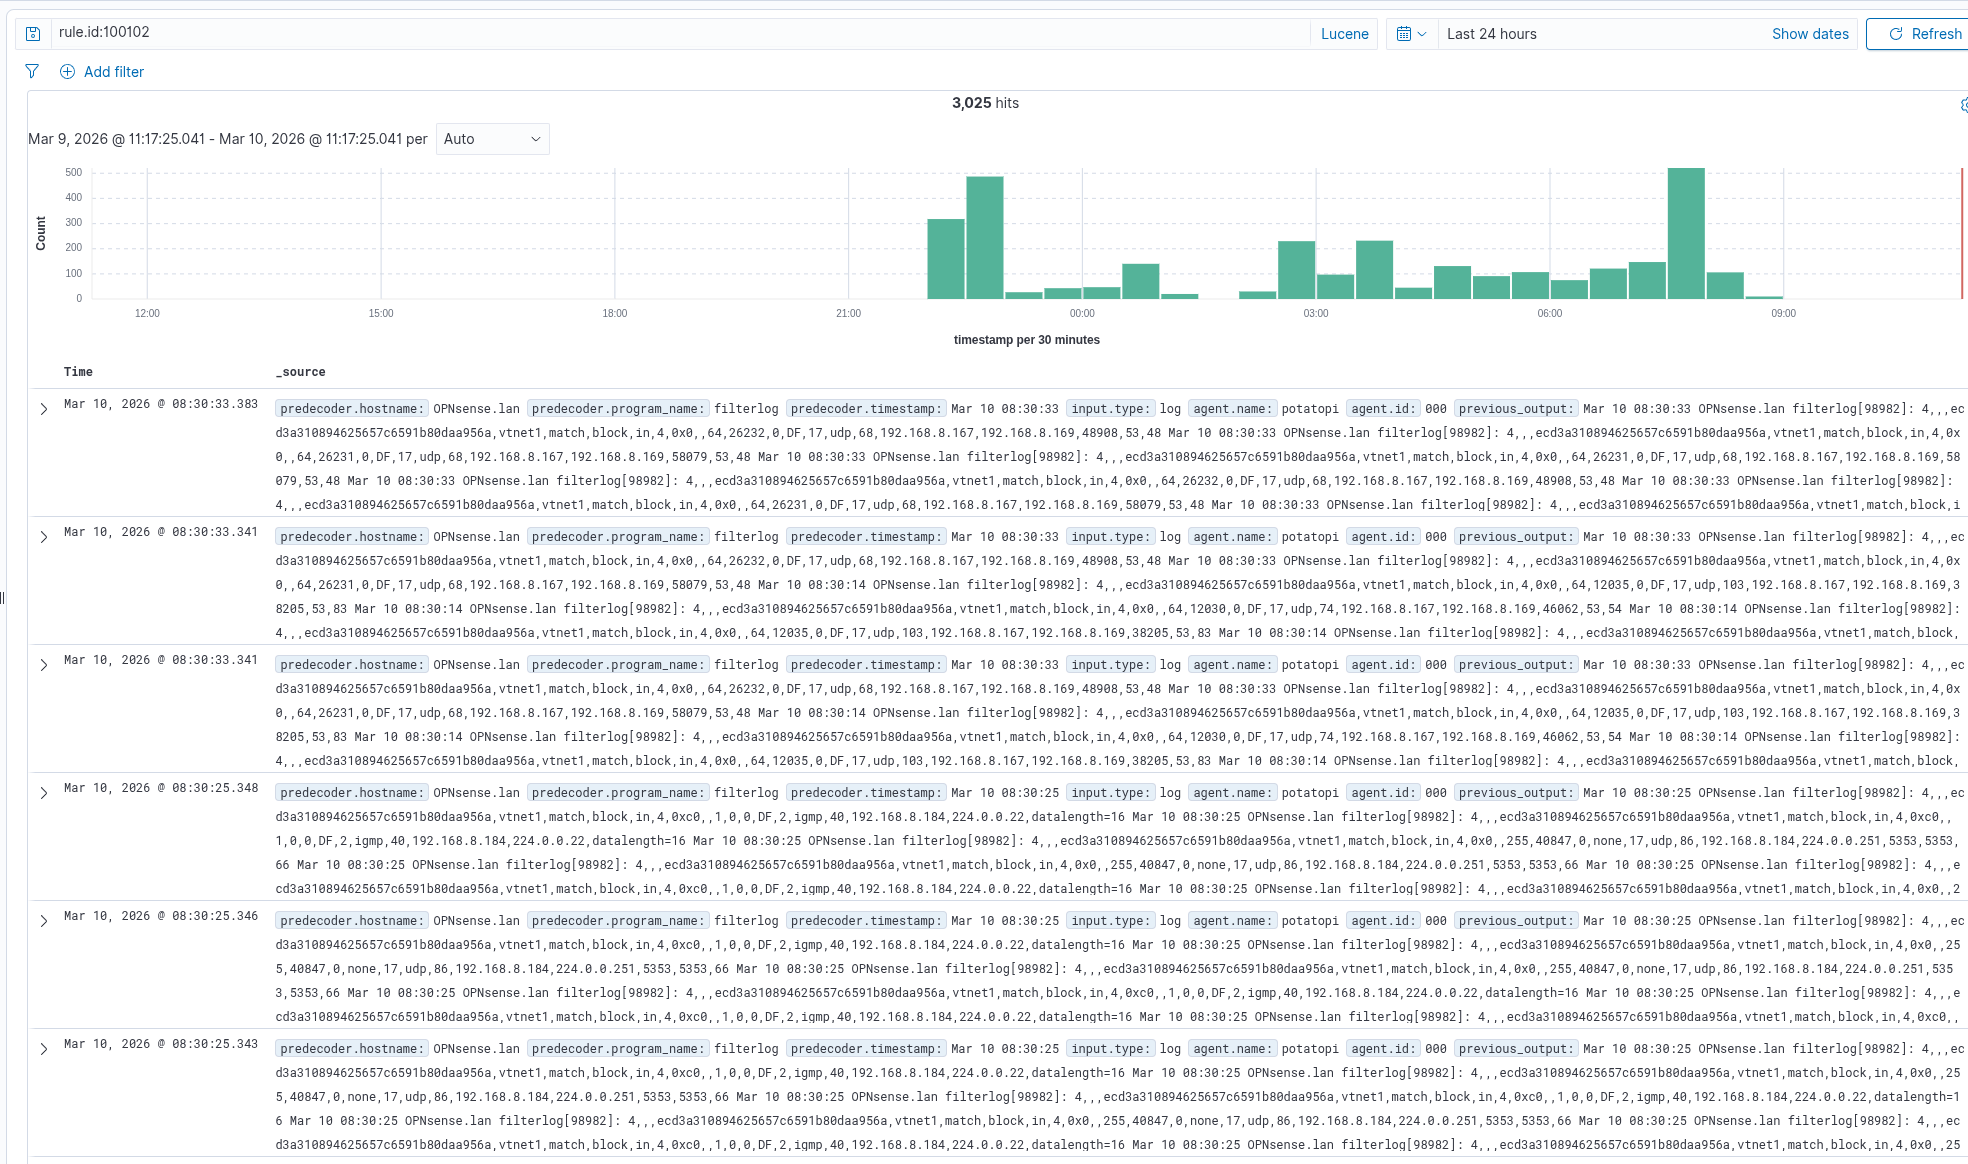
Testing the Detection
To generate firewall events I ran a scan against the network.
1
nmap -p 22,23,80,443 192.168.8.109
The firewall blocked the scan and Wazuh generated alerts.
Searching the dashboard for:
1
rule.id:100102
showed the events immediately.
What the Firewall Logs Show
The logs contain a lot of useful data.
Example fields include:
1
2
3
4
5
protocol: udp
action: block
srcip: 1.1.1.1
dstip: 192.168.8.169
dstport: 53
This allows the SIEM to detect things like:
- port scans
- brute force attempts
- suspicious outbound connections
- external probing
Interesting Network Noise
During testing I saw a lot of blocked traffic like this:
1
239.255.255.250:1900
This is SSDP multicast traffic, usually coming from local devices like smart TVs or consoles.
It’s normal background noise, but it’s interesting seeing it appear in firewall telemetry.
Building a Security Monitoring Dashboard in Grafana
Once the logs and alerts were flowing correctly, I wanted a dedicated monitoring dashboard.
Instead of digging through the Wazuh interface constantly, Grafana lets me visualize security activity in real time.
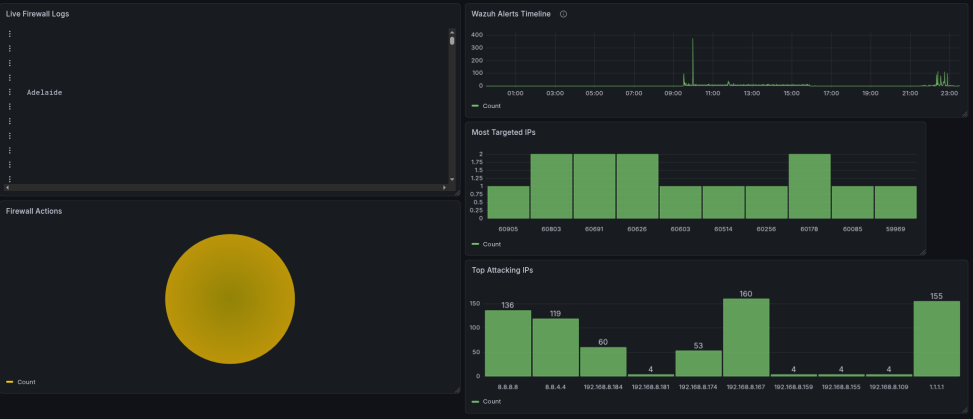
I built a network security dashboard with several panels.
Wazuh Alerts Timeline
The first panel tracks alert activity over time.
Query configuration
Metric: Count Group By: Date Histogram Field: timestamp
Top Attacking IPs
Next I wanted to see which IP addresses were generating the most firewall events.
Lucene query
1
predecoder.program_name:filterlog
Configuration
Metric: Count Group By: Terms Field: srcip
This shows the most active source IPs hitting the firewall.
Most Targeted Ports
To understand what attackers were probing, I created another panel.
Metric: Count Group By: Terms Field: dstport
This highlights which ports are most frequently targeted.
Firewall Actions
This panel shows how the firewall is handling traffic.
Metric: Count Group By: Terms Field: action
Visualization: Pie Chart
This quickly shows the ratio of:
- blocked traffic
- allowed traffic
- other actions
Live Firewall Logs
Finally, I added a real-time log panel.
Query type
Logs
Lucene query
1
predecoder.program_name:filterlog
This creates a live stream of firewall events, which is extremely useful during testing or attack simulations.
This panel streams firewall events live, which is especially helpful when running attack simulations or troubleshooting network activity.
Lessons Learned
This project ended up being a really good reminder that security tooling is rarely plug-and-play.
A few things stood out while building this:
Interface Assignment Matters More Than You Think
Assigning the WAN and LAN interfaces backwards completely broke connectivity.
At first it looked like multiple problems at once:
- no internet access
- DHCP not working
- machines unable to route traffic
But it all traced back to a simple interface mistake. Once those were corrected, the firewall immediately behaved as expected.
Always Verify Logs Before Troubleshooting Detection
Before spending time writing detection rules, I verified that the logs were actually arriving at the Wazuh manager using:
1
tcpdump -i any port 514
Seeing the logs in real time confirmed that the network pipeline was working, which meant the issue was on the detection side, not the logging side.
Built-In Rules Can Save Time
Originally I planned to write a full custom decoder and rule set for OPNsense logs.
While testing, I realized that Wazuh was already detecting the firewall activity using its pfSense ruleset. Instead of rebuilding everything from scratch, I simply extended the existing rule to generate the alerts I wanted.
This ended up being much simpler and avoided unnecessary complexity.
Visualization Makes Monitoring Easier
Once the Grafana dashboard was built, patterns became much easier to see.
Instead of digging through raw logs, the panels quickly show things like:
spikes in firewall alerts
which IPs are scanning the network
the most targeted ports
how the firewall is handling traffic
Not All Traffic Is Malicious
Once firewall telemetry is enabled, you quickly realize how much normal background traffic appears in logs.
During testing I saw repeated entries like:
1
239.255.255.250:1900
This is SSDP multicast traffic, usually generated by devices like smart TVs, game consoles, and other consumer hardware.
It’s harmless, but it’s a good reminder that not every alert is an attack.
If it’s not broken, fix it til it is.