Implementing a Self-Hosted Umami Analytics Dashboard with Cloudflare Zero Trust

I wanted real analytics for my blog - but I didn’t want Google tracking my visitors.
So I deployed Umami analytics in my homelab and protected the dashboard using Cloudflare Zero Trust.
It worked… eventually :) .
Along the way I broke my containers, triggered a 502 error, and accidentally blocked my own analytics traffic.
Here’s how I built the system and what I learned fixing it.
Discovering Umami Analytics
While working on my blog I started thinking about something I didn’t actually have - real analytics.
I could see commits, page builds, and the occasional GitHub Pages traffic spike, but I had no idea who was visiting the site or what posts people were reading.
Most people just drop Google Analytics into their site and call it a day. But that never really sat right with me. I didn’t want to rely on a third-party tracker or hand over visitor data to another company.
That’s when I discovered Umami analytics.
Umami is a lightweight, privacy-friendly, open source analytics platform that you can self-host. It provides clean dashboards and useful visitor insights without cookies or invasive tracking.
Immediately I thought:
This would be perfect to run in my homelab.
My Environment
The stack running in my homelab looks like this:
- Unraid server
- Docker containers
- Umami analytics
- PostgreSQL database
- Cloudflare Tunnel
- Cloudflare Zero Trust Access
- Jekyll blog hosted with GitHub Pages
Architecture overview:
1
2
3
4
5
6
7
8
9
10
11
12
13
14
Visitor

- Website (GitHub Pages)

- Umami script
  - stats.example.com/script.js

  - Cloudflare

- Cloudflare Tunnel

- Unraid Docker

- Umami + PostgreSQL
Dashboard access:
1
2
3
4
5
Admin

Cloudflare Access authentication

Umami dashboard
Deploying Umami
I deployed Umami using Docker along with a PostgreSQL container.
The important environment variable is the database connection string.
1
DATABASE_URL=postgresql://umami:umami@umami-db:5432/umami
Once running, the dashboard was accessible locally.
Creating a Public Subdomain
Inside Cloudflare DNS I created the subdomain:
1
stats.example.com
Traffic to this subdomain is routed through my Cloudflare Tunnel directly to the Umami container running in my homelab.
This allowed the dashboard to be accessed externally.
Adding the Umami Tracking Script
My blog runs on Jekyll using the Chirpy theme, which does not natively support Umami analytics.
Because of this I manually injected the tracking script into the site layout.
1
2
<script defer src="https://stats.example.com/script.js"
        data-website-id="YOUR-UMAMI-WEBSITE-ID"></script>
After rebuilding the site and pushing the changes to GitHub Pages, the analytics script began loading correctly.
Protecting the Dashboard with Cloudflare Access
Inside Cloudflare Zero Trust, I created a new Access application.
Navigation path:
1
Zero Trust > Access > Applications > Add Application
Application type:
1
Self Hosted
Application domain:
1
stats.example.com
This tells Cloudflare that traffic to this dashboard should require authentication.
Creating an Access Policy
I created a policy allowing only my email address.
Policy configuration:
1
2
3
4
Policy name: Allow Admin
Action: Allow
Session duration: 24 hours
Rule selector: Emails
Allowed user:
The First Issue I Ran Into
After enabling Access, visiting the dashboard returned a 502 Bad Gateway error.
Cloudflare displayed the diagnostic page showing:
1
2
3
Browser: Working
Cloudflare: Working
Host: Error
This indicated that the issue was occurring on the origin server rather than at Cloudflare.
What Actually Caused the 502
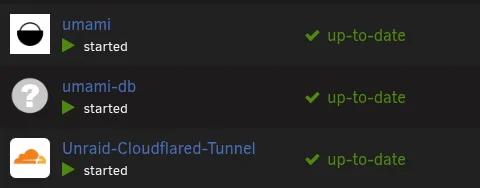
The Umami container had crashed.
Checking the container logs showed me the problem:
1
Can't reach database server at 'umami-db'
This happened because:
- the database container stopped
- containers are not on the same network
- the database hostname does not match the container name
Restarting the database container and then restarting the Umami container resolved the error.
The Second Problem
Even after fixing the container issue, analytics still showed zero visitors.
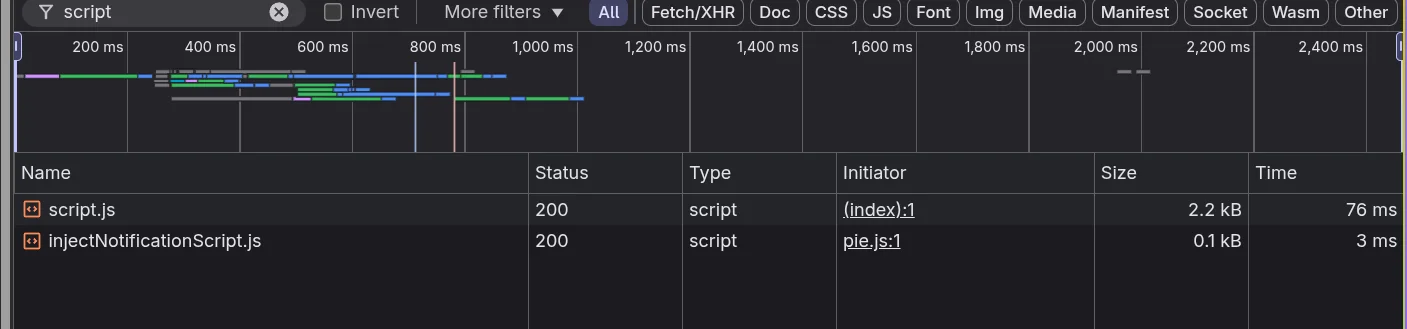
Using the browser developer tools network tab I discovered that:
1
2
script.js loaded successfully
tracking requests were failing
The issue turned out to be related to Cloudflare Access configuration.
The Configuration Mistake
My Access application was protecting the entire subdomain.
1
stats.example.com
That meant Cloudflare was blocking requests to:
1
2
/script.js
/api/send
However, these endpoints must remain public so that visitors can send analytics events.
The Correct Configuration
The fix was restricting Access protection to only the login path.
Public hostname configuration:
1
2
3
Subdomain: stats
Domain: example.com
Path: /login*
This allows analytics traffic while protecting the dashboard login.
Public endpoints that remain accessible:
1
2
stats.example.com/script.js
stats.example.com/api/send
Protected endpoint:
1
stats.example.com/login
Verifying That Analytics Works
Using the browser developer tools network tab I confirmed the requests were successful.
1
2
script.js → 200
/send → 200
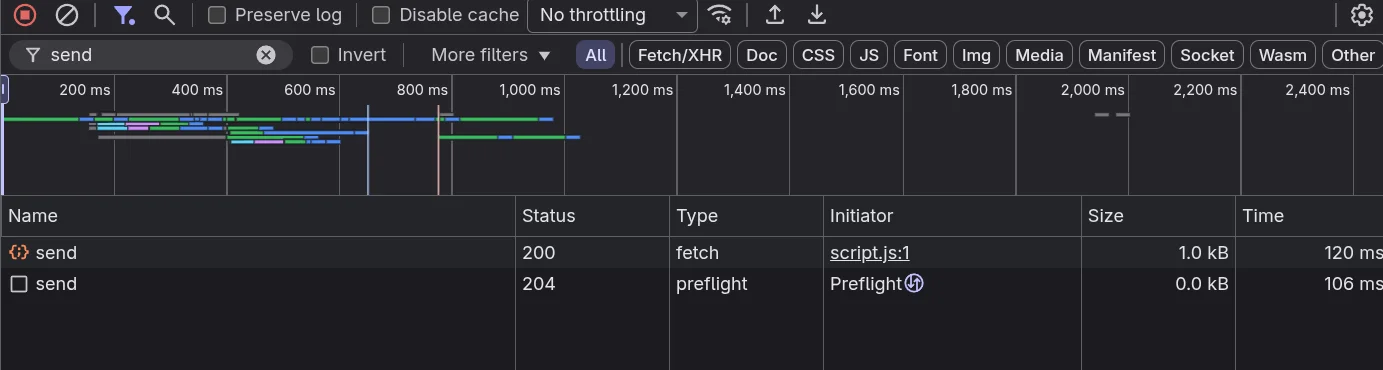
This confirmed that the analytics event was successfully recorded.
Shortly after, my Umami dashboard began showing visitors.
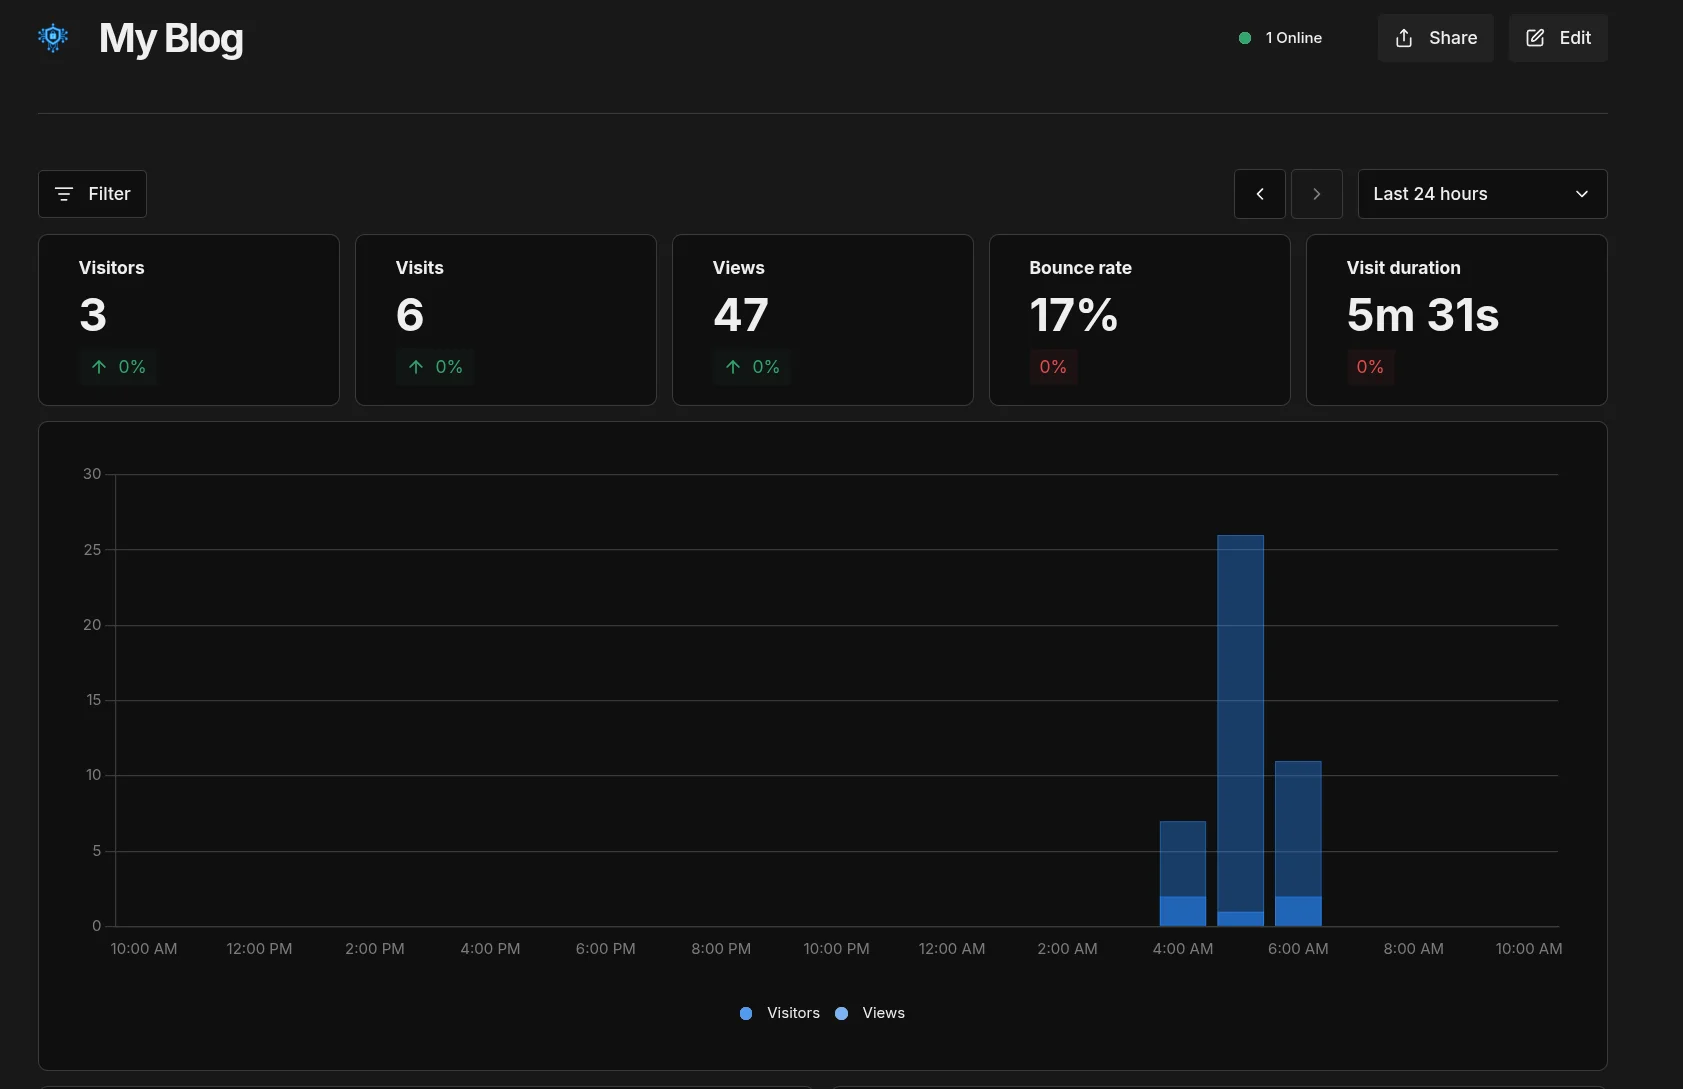
Final Result
Visitors can load the analytics script normally, while the dashboard remains protected.
Analytics flow:
1
Visitor > Website > Umami script > Analytics stored
Admin access flow:
1
Admin > Cloudflare Access > Email authentication > Umami dashboard
Lessons Learned
A few things I learned while setting this up:
- Protecting an entire subdomain with Cloudflare Access can break API endpoints
- Analytics scripts must remain publicly reachable
- Container networking issues can surface as 502 errors in Cloudflare
- Browser developer tools are extremely useful for debugging analytics
The biggest lesson was that security controls can easily break application functionality if they are applied too broadly.
This is part of the security lab I run in my homelab where I experiment with SIEM, honeypots, detection engineering, and infrastructure security.
If it’s not broken, fix it til it is.