Building a Grafana + Prometheus Monitoring Stack in My Unraid Homelab
Note: This setup was originally built on Unraid, I’ve since migrated my homelab to Proxmox, but the concepts still apply.
I wanted better visibility into my homelab.
I already had a growing Unraid server with a bunch of containers running on it, but I did not have a clean way to actually monitor what was happening across the host and Docker workloads in one place.
So I built a monitoring stack with:
- Grafana for dashboards
- Prometheus for scraping and storing metrics
- Node Exporter for host-level Unraid metrics
- cAdvisor for container-level Docker metrics
It worked, but not without a few mistakes along the way.
This post walks through how I got it working on Unraid, what broke, and what I learned fixing it.
Why I Wanted This
At this point my server is running a decent mix of services, and I wanted answers to questions like:
- How much CPU and RAM is the host actually using?
- Which Docker containers are the heaviest?
- What is my network traffic doing?
- How can I spot issues before something crashes?
I didn’t just want a single number in Unraid. I needed full visibility.
My Environment
This setup was built on:
- Unraid OS
- Docker containers managed through Unraid
- Grafana
- Prometheus
- Node Exporter plugin
- cAdvisor
The goal was to monitor both:
- the Unraid host itself
- the containers running on top of it
The Monitoring Layout
The stack ended up looking like this:
1
2
3
4
5
6
7
8
9
Unraid Host
  - Node Exporter > host metrics
  - cAdvisor > container metrics

Prometheus
  - collects and stores metrics

Grafana
  - dashboards and visualization
That gave me two layers of visibility:
Host metrics
- CPU
- RAM
- disk usage
- system load
- network traffic
- uptime
Container metrics
- CPU per container
- memory per container
- container network activity
Installing Grafana on Unraid
I installed Grafana through the Apps tab in Unraid rather than Docker Compose.
That is an important distinction because many tutorials assume a generic Linux setup, while Unraid typically uses Community Applications templates.
My Grafana container used:
- Port 3000 internally
- A mapped host port for web access
- Appdata stored under:
1
/mnt/user/appdata/grafana
Local access looked like:
1
http://192.168.8.159:3001
Once Grafana loaded I could log in and start configuring data sources.
Installing Prometheus on Unraid
Prometheus also went in through Unraid Apps.
The important part was understanding that Prometheus requires:
- a data directory
- a config directory
- a valid prometheus.yml
My host mappings looked conceptually like this:
1
2
/prometheus      > /mnt/user/appdata/prometheus/data
/etc/prometheus  > /mnt/user/appdata/prometheus/etc
Prometheus ran on:
1
http://192.168.8.159:9090
My First Big Mistake: Breaking the Prometheus Config Mount
Prometheus kept auto-stopping and the logs showed:
1
2
Error loading config (--config.file=/etc/prometheus/prometheus.yml)
read /etc/prometheus/prometheus.yml: is a directory
That happened because Unraid accidentally created a directory instead of a file.
I also made the mistake of trying to mount:
- the entire
/etc/prometheus/directory - and
/etc/prometheus/prometheus.ymlindividually
That caused a conflict.
What fixed it
I kept only the directory mount and created the config file inside:
1
/mnt/user/appdata/prometheus/etc/prometheus.yml
Once the file actually existed as a file (not a folder), Prometheus started normally.
Lesson learned
If Prometheus says prometheus.yml is a directory, your config mount is wrong.
Building the Initial Prometheus Config
My starting config was intentionally simple:
1
2
3
4
5
6
7
global:
  scrape_interval: 15s

scrape_configs:
  - job_name: 'unraid'
    static_configs:
      - targets: ['192.168.8.159:9100']
This scraped Node Exporter running on my Unraid host.
Later I expanded it to include cAdvisor.
Installing Node Exporter
For host-level metrics I installed the Node Exporter plugin.
Metrics appeared at:
1
http://192.168.8.159:9100/metrics
Seeing that giant wall of metrics was the first confirmation the stack was working.
Prometheus targets also showed:
1
unraid > UP
which meant scraping was successful.
Connecting Prometheus to Grafana
Inside Grafana I added Prometheus as a data source.
Settings were simple:
1
2
URL: http://192.168.8.159:9090
Auth: none
Initially I overcomplicated things by trying to enable authentication.
Once I removed that, Grafana connected instantly.
Importing the First Dashboard
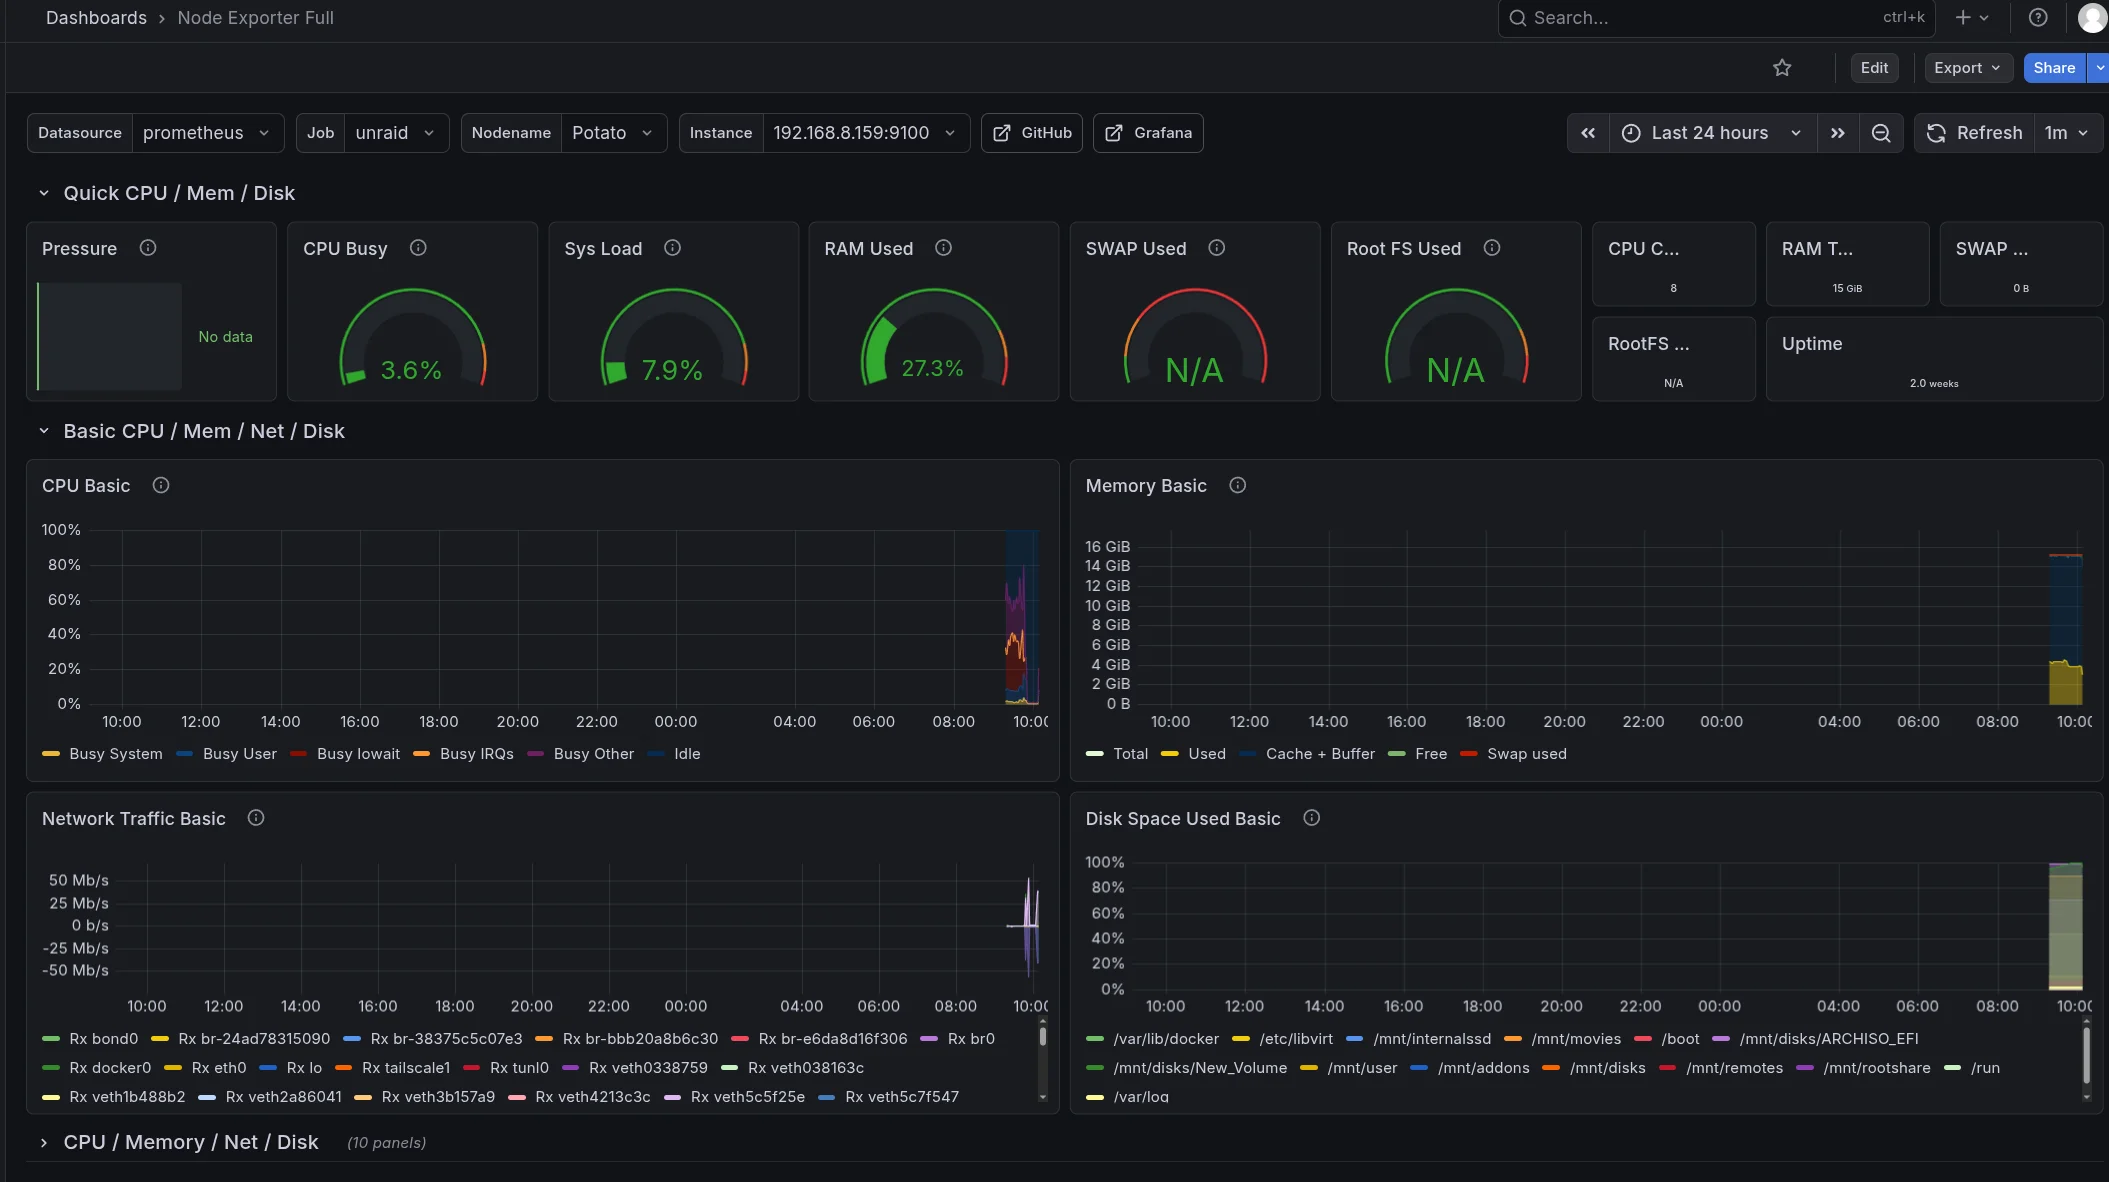
The first dashboard that worked well was Node Exporter Full.
It showed:
- CPU usage
- system load
- RAM usage
- network traffic
- disk utilization
- uptime
Some panels like swap or pressure metrics showed N/A.
That turned out to be normal because Unraid exposes some metrics differently than standard Linux systems.
Lesson learned
Generic Linux dashboards do not always map perfectly to Unraid.
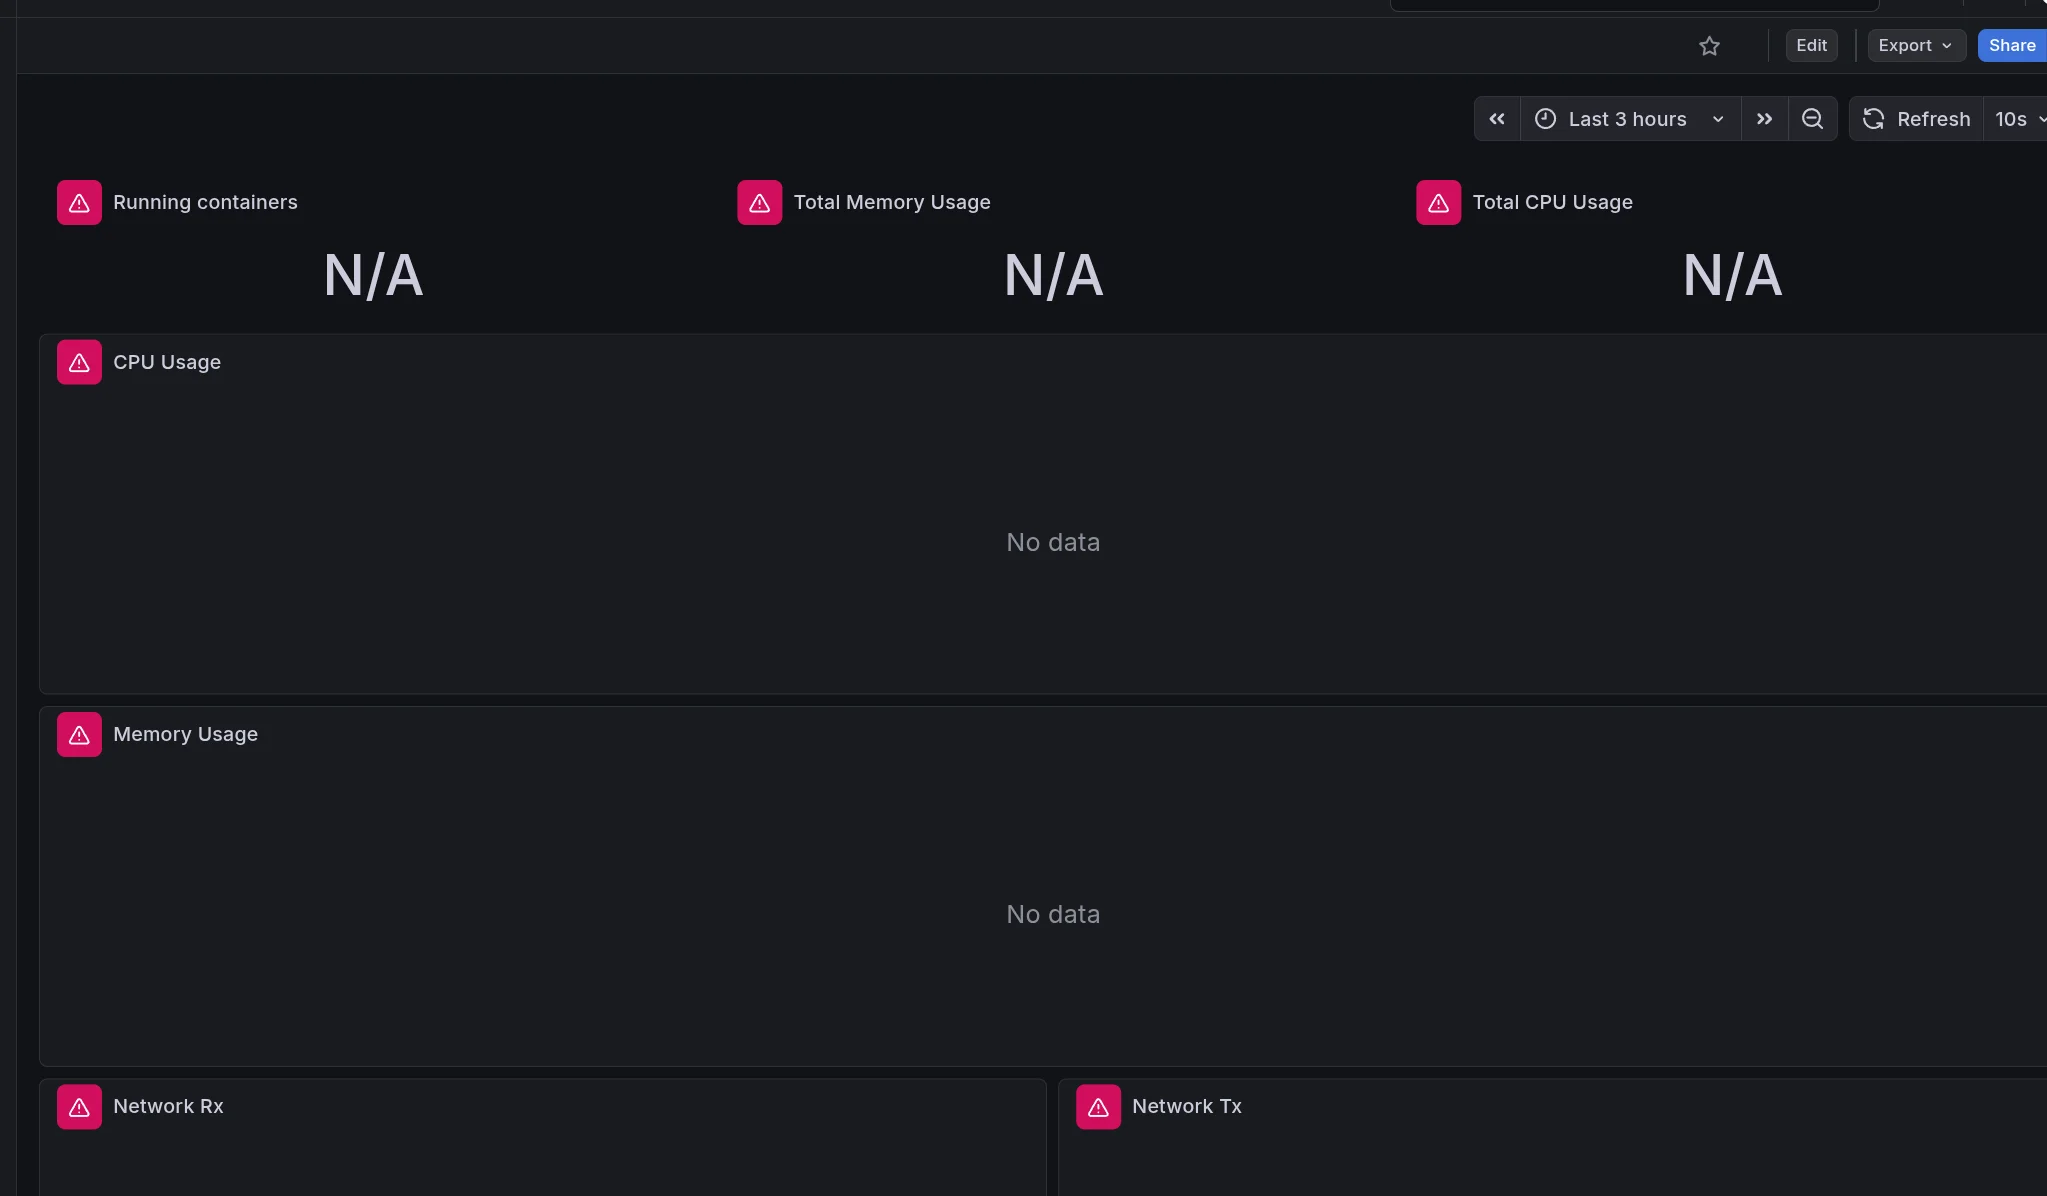
Fixing Queries So the Panels Actually Show Data
One thing that surprised me while building the dashboards was how often panels imported from Grafana’s dashboard library simply showed:
1
No data
At first I assumed something was broken in my stack, but the real issue turned out to be query labels not matching my environment.
Many dashboards assume container metrics expose labels like:
1
2
3
container
name
container_name
In my setup, cAdvisor exposed the Docker container identifier through the id label instead.
That meant queries written like this would return nothing:
sum by (container) (rate(container_cpu_usage_seconds_total[1m]))
But when I adjusted the query to match the label I actually had, it worked:
sum by (id) (rate(container_cpu_usage_seconds_total{id=~"/docker/.*"}[1m]))
The same adjustment was needed for other panels.
Example working queries
CPU per container
sum by (id) (
  rate(container_cpu_usage_seconds_total{id=~"/docker/.*"}[1m])
)
Memory per container
sum by (id) (
  container_memory_usage_bytes{id=~"/docker/.*"}
)
Network receive
sum by (id) (
  rate(container_network_receive_bytes_total{id=~"/docker/.*"}[1m])
)
Network transmit
sum by (id) (
  rate(container_network_transmit_bytes_total{id=~"/docker/.*"}[1m])
)
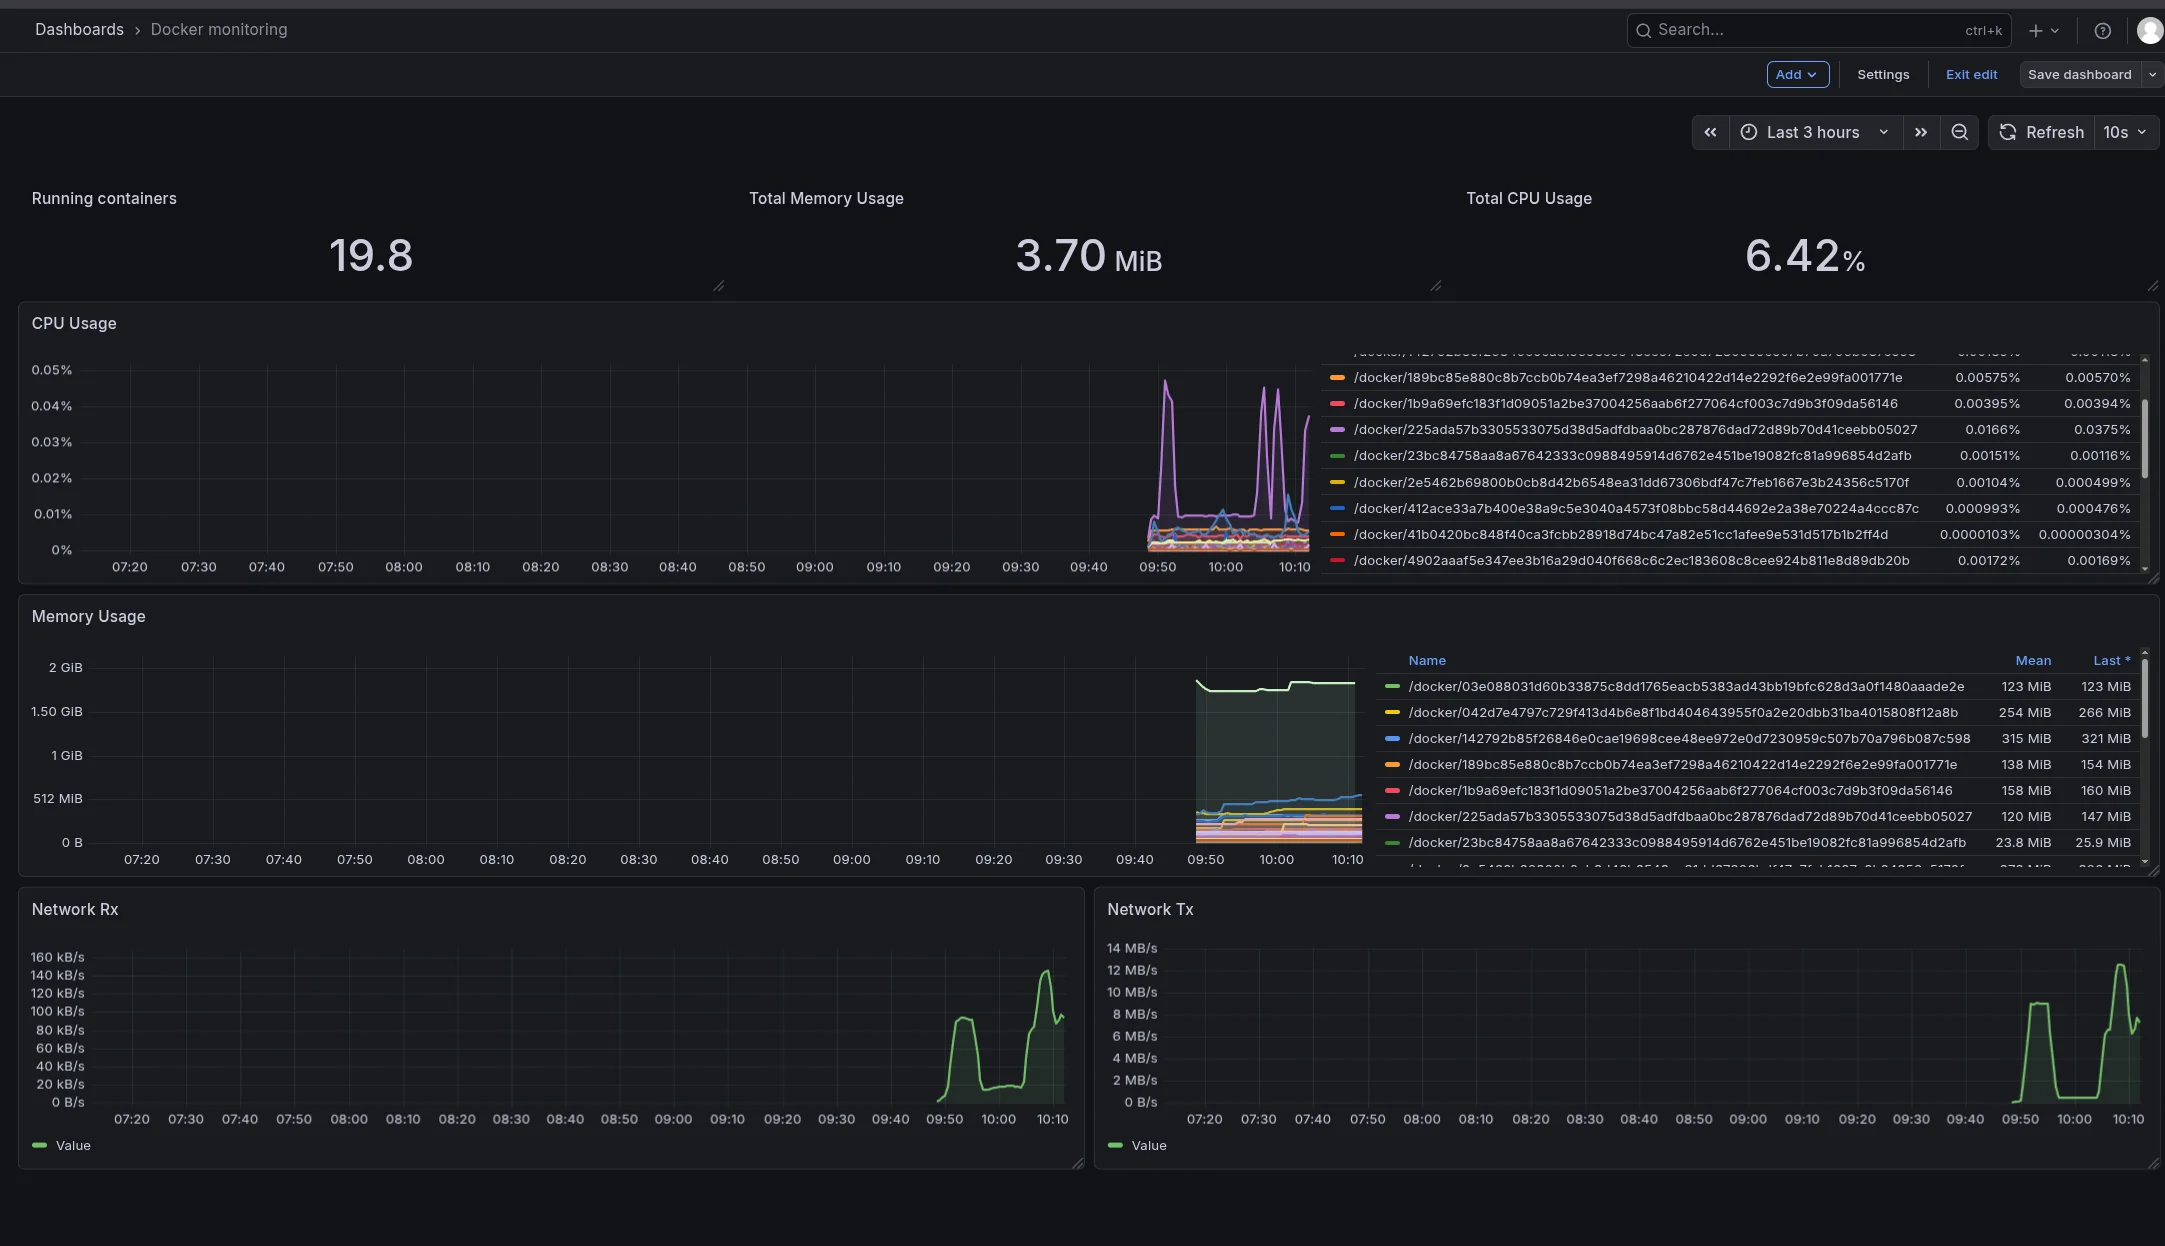
The key takeaway was that Grafana dashboards are not universal.
If the metric labels do not match what the dashboard expects, panels will show no data even though Prometheus is collecting metrics perfectly.
Once I started testing queries in Grafana Explore and adjusting the labels, the dashboards immediately began working.
Adding cAdvisor for Container Metrics
To monitor Docker containers I installed cAdvisor.
Configuration included:
- privileged mode enabled
- port 8082
- Docker and system mount paths
The UI appeared at:
1
http://192.168.8.159:8082
Then I updated prometheus.yml:
1
2
3
4
5
6
7
8
9
10
11
global:
  scrape_interval: 15s

scrape_configs:
  - job_name: 'unraid'
    static_configs:
      - targets: ['192.168.8.159:9100']

  - job_name: 'cadvisor'
    static_configs:
      - targets: ['192.168.8.159:8082']
After restarting Prometheus both targets showed:
1
2
unraid  > UP
cadvisor > UP
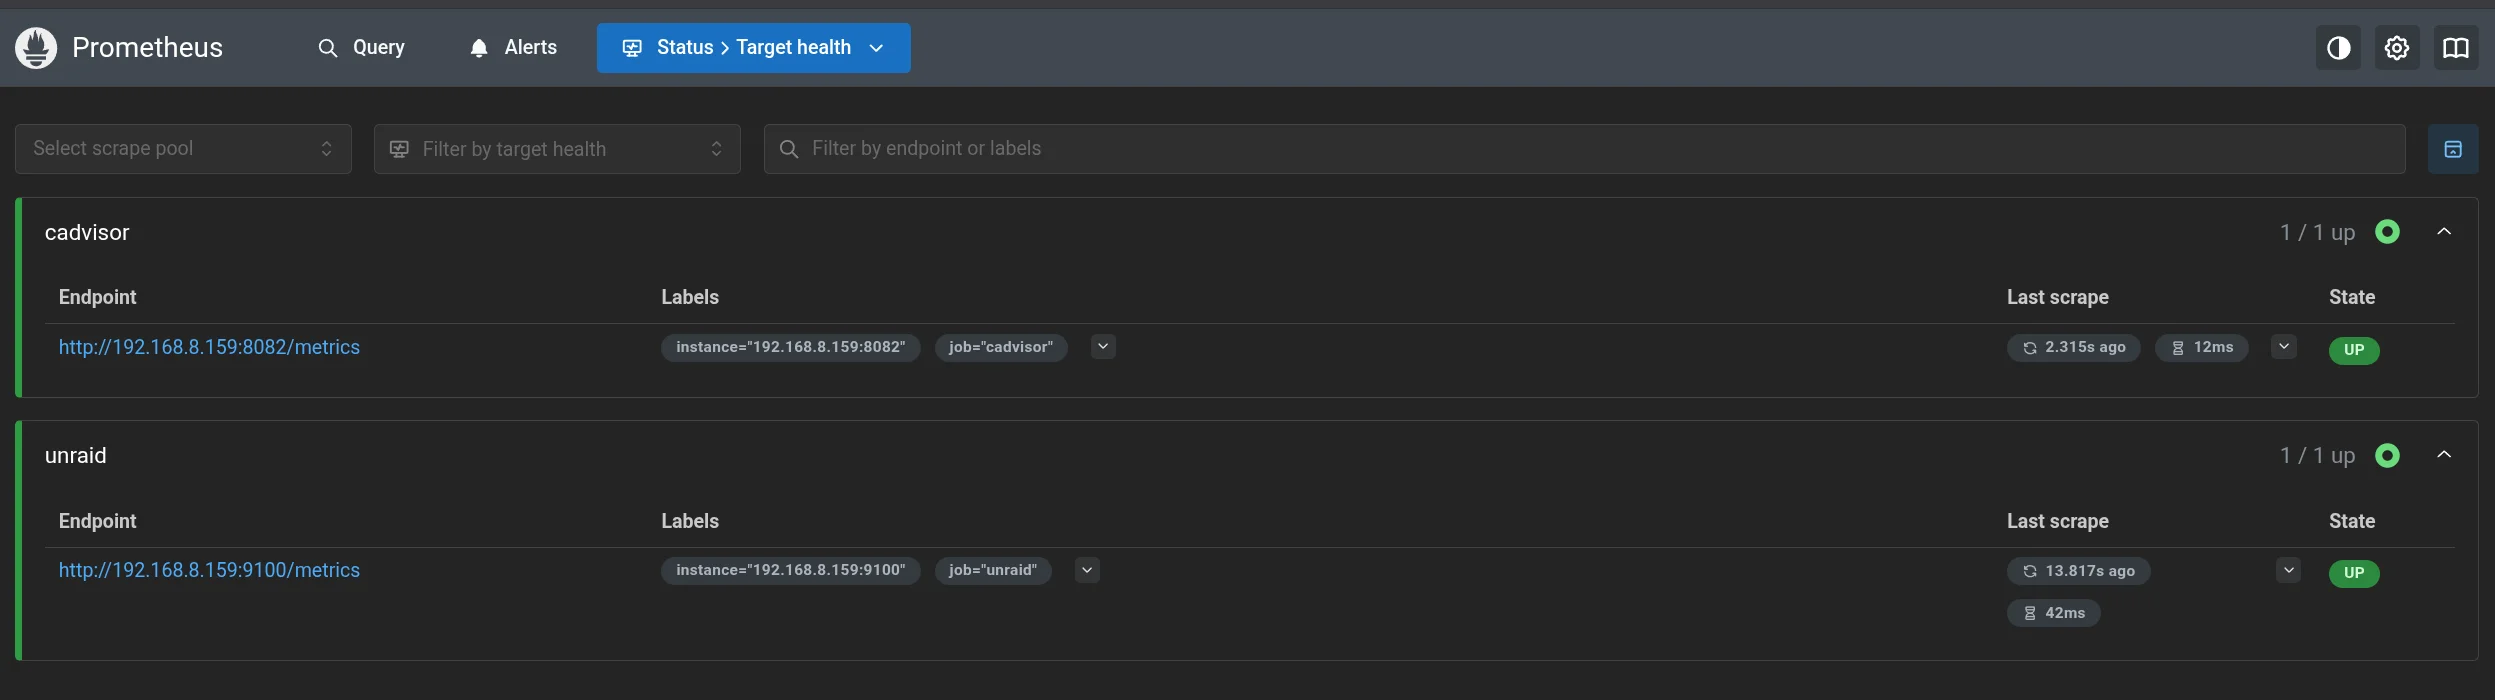
At that point the full stack was working.
What I Ended Up Monitoring
Host metrics
From Node Exporter:
- CPU
- memory
- load
- uptime
- disk usage
- network traffic
Container metrics
From cAdvisor:
- running containers
- container CPU usage
- container memory usage
- network RX/TX
- resource usage by container
Final Thoughts
This project started as:
“I just want a nice dashboard.”
By the end I had:
- Prometheus collecting metrics
- Grafana visualizing them
- Node Exporter monitoring the host
- cAdvisor monitoring containers
Now the server finally feels observable instead of a black box.
If it’s not broken, fix it til it is.