Deploying pfSense on a Protectli Firewall in My Homelab
Why I Added pfSense to My Lab
I had previously installed OPNSense on my Unraid server but it was conflicing with a lot of the network so I bought a Protectli Vault to have more segmentation on my devices and network.
So I decided to install pfSense on a Protectli firewall appliance and work it into my homelab so I could generate real firewall telemetry and send it into Wazuh.
Up until this point I already had:
- A Raspberry Pi 4 running Wazuh Manager
- A Windows Server domain controller
- Multiple Windows clients with Sysmon
- A Kali attack machine
- Several services running on my Unraid server
That was already a solid start, but one big piece was missing:
A real firewall generating logs.
This post covers the full process, including:
- Installing pfSense on the Protectli
- Initial network setup
- What I broke
- DNS issues
- Pi-hole issues
- Why my logs were not showing in Wazuh at first
- How I fixed everything
Hardware Used
For this setup I used a Protectli firewall appliance.
These little fanless boxes are great for homelabs because they:
- use very little power
- have multiple NICs
- are made for firewall operating systems like pfSense and OPNsense
My network path now looks like this:
1
2
3
4
5
6
7
8
9
Verizon Router
        |
GL.iNet Repeater
        |
Protectli Firewall (pfSense)
        |
Switch
        |
Homelab Systems
My lab subnet is:
1
192.168.50.0/24
Creating the pfSense Boot USB
I created the installer USB from my Arch Linux workstation.
First I downloaded the pfSense installer image from Netgate. Then I wrote it to a USB drive.
Example command:
1
2
sudo dd if=pfSense-CE.iso of=/dev/sdX bs=4M status=progress
sync
After writing the image, I plugged the USB into the Protectli and booted from it.
Booting the Protectli
After powering on the Protectli, I entered the BIOS and changed the boot order so it would boot from the USB installer first.
1
2
3
Boot Order
1. USB
2. SSD
After rebooting, the pfSense installer launched successfully.
Problem #1: Installation Failed on the SSD
The first real issue showed up during installation.
When I selected the SSD as the destination disk, the installer failed. At first I thought one of these had to be the problem:
- bad SSD
- bad USB write
- corrupt installer image
That turned out not to be the issue.
What fixed it
Instead of fighting the disk layout manually, I used the default installer option and let pfSense handle the storage configuration automatically.
I selected the automatic install option and completed setup that way instead of trying to get fancy with manual disk choices.
Once I stopped overcomplicating that part, the install finished.
Assigning Interfaces
After installation, pfSense rebooted and dropped into interface assignment.
I assigned the NICs like this:
1
2
WAN > igb0
LAN > igb1
After that, pfSense assigned the LAN interface:
1
192.168.50.1
That became the management IP for the firewall.
Logging Into the Web Interface
From another machine on the network, I opened:
1
https://192.168.50.1
The web interface loaded and I logged in with the default credentials:
1
2
Username: admin
Password: pfsense
After that I worked through the basic setup wizard.
My Goal Was Never Just “Install It”
The real reason I wanted pfSense in the lab was not just to say I installed a firewall.
I wanted this flow:
1
2
3
4
5
6
7
8
9
Attack traffic
    |
pfSense firewall logs
    |
Remote syslog
    |
Wazuh Manager
    |
Threat hunting / detections
That was the goal from the start.
Moving My Lab Behind pfSense
Once pfSense was up, I had to move the lab behind it.
The idea was:
1
2
3
GL.iNet > pfSense WAN
pfSense LAN > switch
switch > lab systems
That sounds simple written out, but this is where I broke a lot of things.
Problem #2: DNS Broke Everything
Once I started moving devices behind pfSense, internet access got weird fast.
I had systems that could:
- ping IP addresses
- reach the gateway
- reach pfSense
but could not resolve domain names
That told me routing was mostly fine, but DNS was broken.
I confirmed that by testing from my system:
1
ping 8.8.8.8
That worked.
Then:
1
ping google.com
That failed.
If my routing was broken, both tests would have failed. But only domain resolutions were failing. This confirms this was a DNS issue.
Pi-hole Made This More Complicated
Part of the confusion came from the fact that I was already using Pi-hole.
Originally, Pi-hole was living on my old network and serving DNS from a different address. Once I moved everything behind pfSense, the old DNS path no longer made sense.
My Pi-hole had been reachable on the older network, but now my lab subnet had changed to:
1
192.168.50.0/24
So I needed Pi-hole to exist on the new subnet too.
What I changed
I moved Pi-hole from the old subnet to the new one and gave it a new address on the pfSense LAN:
1
192.168.50.69
Once Pi-hole was on the correct subnet, the DNS path finally started making sense again.
Problem #3: My System Was Still Pointing to the Wrong DNS Server
Even after Pi-hole moved, DNS still did not work right away.
The issue was that some systems were still using the wrong resolver.
For example, I confirmed one system was still trying to use:
1
127.0.0.53
instead of the actual Pi-hole server.
That meant name resolution was failing locally even though Pi-hole itself was alive and working.
What fixed it
I updated the DNS server to point to:
1
192.168.50.69
Then I restarted networking and confirmed resolution manually with:
1
nslookup google.com 192.168.50.69
That returned a valid result.
At that point I knew:
- Pi-hole was reachable
- Pi-hole could resolve domains
- the issue was just getting systems to actually use it
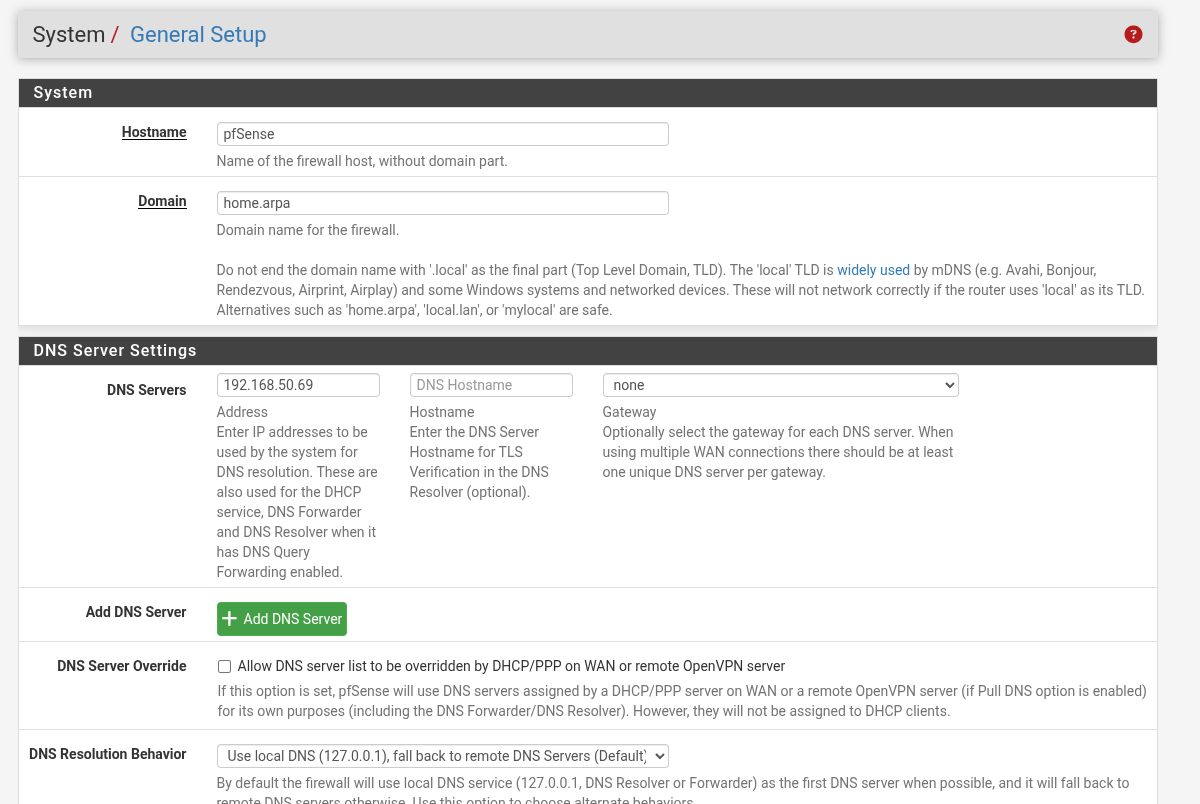
pfSense General DNS Settings
Inside pfSense, I updated the firewall’s own DNS settings.
I ended up setting the firewall to use a normal upstream resolver first while I stabilized the environment, instead of immediately forcing everything through Pi-hole before the rest of the network was healthy.
That helped separate routing problems from DNS problems.
Once I verified connectivity, I was able to point things where I wanted them.
LAN DHCP and DNS
On the pfSense side, I configured the LAN DHCP server to hand out addresses on the new subnet.
My LAN range ended up looking like:
1
192.168.50.100 - 192.168.50.200
And for DNS, I wanted clients to eventually use Pi-hole at:
1
192.168.50.69
That way the flow became:
1
2
3
4
5
Client
  |
Pi-hole
  |
Upstream DNS
instead of clients trying to resolve names on their own.
Problem #4: Tailscale Was Confusing Name Resolution
At one point I realized one of my systems was still using Tailscale DNS in the background, which was causing a lot of confusion when troubleshooting.
That made it look like DNS was still broken when in reality the machine was not using the resolver I thought it was using.
Turning that off made testing much cleaner.
That was one of those annoying issues where the network is technically working, but one overlay service makes you think it is not.
Verifying pfSense Was Actually Working
Once the network stabilized, I verified the basics:
- pfSense LAN reachable at
192.168.50.1 - WAN up
- clients receiving
192.168.50.xaddresses - internet access working
- DNS resolving properly
- Pi-hole reachable on the new subnet
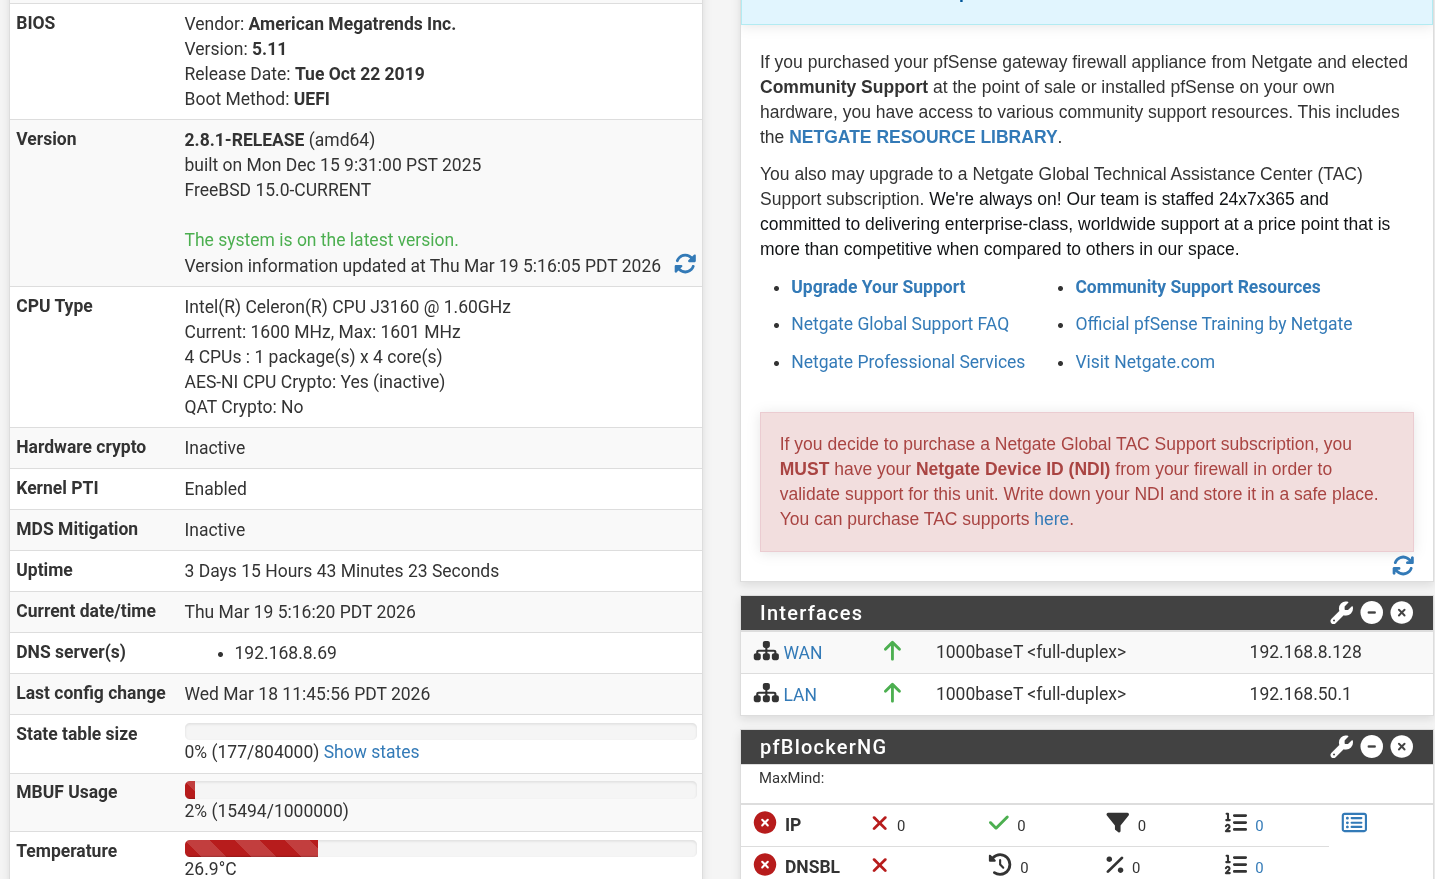
At that point I knew the firewall was finally sitting in the right place in the lab.
Sending pfSense Logs to Wazuh
This was the whole reason for the build.
Inside pfSense, I went to:
1
Status > System Logs > Settings
Then I enabled remote logging and pointed it at my Wazuh server:
1
192.168.50.101:514
I enabled these remote syslog contents:
- System Events
- Firewall Events
- DNS Events
- DHCP Events
- General Authentication Events
Wazuh Syslog Listener Configuration
On the Wazuh manager, I configured it to listen for syslog from the lab subnet.
My Wazuh syslog listener looked like this:
1
2
3
4
5
6
<remote>
  <connection>syslog</connection>
  <port>514</port>
  <protocol>udp</protocol>
  <allowed-ips>192.168.50.0/24</allowed-ips>
</remote>
That part was correct.
pfSense was allowed to send.
Problem #5: Logs Were Reaching Wazuh, But I Still Could Not Find Them
This was one of the most annoying parts.
I ran:
1
sudo tcpdump -i any port 514
and could clearly see syslog packets arriving from pfSense.
So I knew:
- pfSense was sending
- Wazuh was receiving
- network path was fine
But in Discover I still could not find the events the way I expected.
That made it feel like nothing was working even though packets were literally hitting the box.
What Was Actually Happening
The issue turned out to be a mix of these things:
- Wazuh was ingesting logs
- Discover searches were using the wrong fields
- Some pfSense logs were being stored as generic syslog instead of the exact structured fields I expected
So searching for a plain IP in the wrong field returned nothing even though the data existed.
Enabling Firewall Rule Logging Properly
To make pfSense generate the traffic logs I actually wanted, I also had to make sure the firewall rules themselves were logging.
On the LAN rule, I enabled:
1
Log packets that are handled by this rule
I also enabled pfSense logging preferences for:
- default block rules
- default pass rules
That made pfSense much more chatty, which was exactly what I wanted for a detection lab.
Generating Traffic From Kali
Once the firewall was in place and logging was enabled, I used my Kali machine to generate traffic.
My Kali box ended up on the lab subnet as:
1
192.168.50.102
From there I ran scans like:
1
nmap -Pn -p 22,80,443,8080 192.168.50.101
and
1
nmap -Pn -p 22,80,443,8080 192.168.50.1
That generated real firewall activity through pfSense.
Problem #6: Same Subnet Confusion
I questioned whether scanning from Kali on the same subnet would even work.
But once I looked at the actual pfSense firewall logs, it was clear the traffic was being logged.
I could see entries like:
- source
192.168.50.102 - destination
192.168.50.1 - rule
Default allow LAN to any rule - protocol
TCP:S
So yes, even though the systems were on the same subnet, pfSense was still logging the traffic I cared about in this setup.
Confirming pfSense Logs Were Real
At this point I had two good confirmations:
On pfSense itself
The firewall log showed traffic from Kali being logged correctly.
On the Wazuh server
tcpdump showed remote syslog traffic coming from pfSense.
That proved the core pipeline was working:
1
2
3
4
5
6
7
Kali
  |
pfSense
  |
syslog
  |
Wazuh
Final Network Layout
This is the layout I ended up with:
1
2
3
4
5
6
7
8
9
10
11
12
13
Verizon Router
        |
GL.iNet Repeater
        |
Protectli Firewall (pfSense)
        |
Switch
        |
- Wazuh Manager (Raspberry Pi) - 192.168.50.101
- Pi-hole - 192.168.50.69
- Kali - 192.168.50.102
- Windows Server / clients
- Other homelab systems
What I Broke Along the Way
This setup was not smooth, and that honestly made it more useful.
Things I broke during this process:
- pfSense installer failing on disk setup
- DNS after moving the lab behind the firewall
- Pi-hole accessibility after subnet changes
- clients pointing to the wrong DNS server
- confusion caused by Tailscale DNS
- Wazuh queries returning nothing even though logs were arriving
What I Fixed
By the end, I had fixed:
- pfSense installation on the Protectli
- WAN/LAN interface assignment
- lab subnet moved to
192.168.50.0/24 - Pi-hole moved onto the correct subnet
- clients resolving DNS properly again
- pfSense remote syslog sending to Wazuh
- LAN firewall rules logging traffic
- verified traffic generation from Kali
- verified log delivery to Wazuh
Why This Matters
This is one of the better upgrades I have made to my homelab.
Before this, my detection practice was mostly endpoint-focused.
Now I have:
- endpoint telemetry
- firewall telemetry
- DNS visibility
- real attack traffic crossing the network
- something much closer to a real SOC-style pipeline
That makes the lab way more useful for:
- threat hunting
- network log analysis
- detection engineering
- practicing realistic attack simulations
What I Want to Do Next
Now that pfSense is in place, the next step is building detections around it.
I want to use this setup to:
- detect port scans
- detect brute-force attempts
- build Wazuh rules for firewall activity
- create visual dashboards around network events
- simulate attacker behavior and trace it across the stack
Final Thoughts
Installing pfSense on the Protectli was absolutely worth it, even though I broke half my network getting there.
It gave me a much more realistic foundation for the lab and finally let me start treating the network itself as a telemetry source instead of just relying on endpoint logs.
And honestly, breaking DNS, fighting Pi-hole, and questioning whether anything was working was part of the process.
That is also why I wanted to document it.
Because this kind of setup never looks hard when you only see the final diagram.
It gets hard in the middle, when the gateway works, DNS does not, the firewall sends logs you cannot find, and every fix creates a new problem.
But once it finally clicks, the lab becomes way more powerful.
If it’s not broken, fix it til it is.