Enhancing Wazuh Telemetry with Sysmon on Windows Server

Enhancing Wazuh Telemetry with Sysmon on Windows Server
Wazuh pulls a lot of data from Windows Event Viewer by default. But after digging through the logs, I realized it’s not rich enough for the level of visibility I want.
While you get security logs and authentication attempts, you miss deeper process visibility - command lines, parent-child process relationships, hashes, and detailed execution telemetry. To give Wazuh more “eyes and ears,” I decided to install Sysmon.
Why Sysmon?
Here is the link to the documentation that I followed to get this set up.
Windows native logging is fine, but Sysmon provides the kind of telemetry that makes a SIEM actually useful:
- Process creation with full command-line logging
- Parent-child process relationships
- Network connections
- File creation timestamps
- Hashes (depending on configuration)
- Detailed operational visibility
This is the type of logging that got me hands on what it really looks like when attacks come in.
Downloading and Extracting Sysmon
I downloaded Sysmon from the official Microsoft Sysinternals page:
I extracted the contents directly to:
1
C:\Sysmon
I like to keep my files in a easy to access place for simplicity
Grabbing a Sysmon Configuration File
Sysmon requires a configuration file that defines exactly what gets logged.
From an elevated PowerShell session, I navigated to the Sysmon directory:
1
cd C:\Sysmon
Then I downloaded a pre-defined configuration file provided by the Wazuh team to ensure compatibility:
1
wget https://wazuh.com/resources/blog/emulation-of-attack-techniques-and-detection-with-wazuh/sysmonconfig.xml -OutFile sysmonconfig.xml
I verified the file downloaded successfully:
1
ls
To make sure sysmonconfig.xml appeared in the directory. Which is did!
Installing Sysmon
Then I installed Sysmon with the configuration file.
Important: Open PowerShell or Command Prompt as Administrator. I may have forgot…
Then I ran:
1
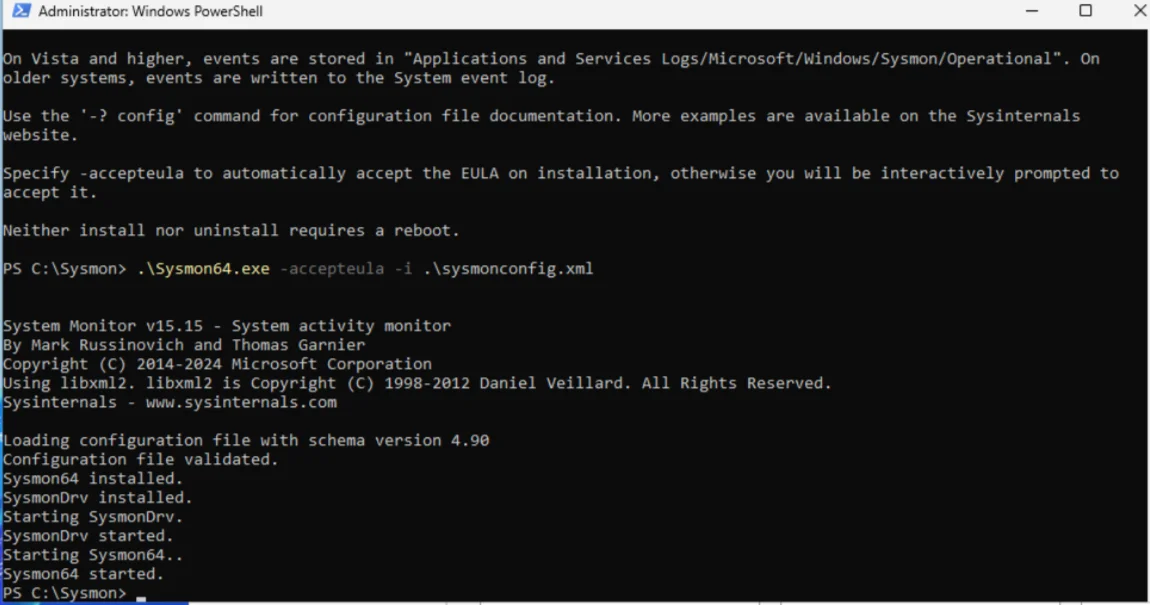
.\Sysmon64.exe -accepteula -i .\sysmonconfig.xml
The first time I ran this, I forgot to open the terminal with Administrator privileges and received an error.
Closed it. Reopened as Admin. Ran the command again. Installation completed successfully.
Verifying Sysmon is Running
After installation, I confirmed Sysmon is active by checking:
Event Viewer > Applications and Services Logs > Microsoft > Windows > Sysmon > Operational
If logs are populating, Sysmon is running correctly and feeding enhanced telemetry into Windows Event Logs which Wazuh will now ingest.
Sidebar: Expanding Windows Telemetry Awareness
I found out about this website that made it easier to make rules for Sysmon.
LOLBAS (Living Off The Land Binaries, Scripts and Libraries) is a resource listing legitimate Windows binaries that threat actors commonly abuse.
This is important because many attacks use native Windows tools instead of malware.
For example:
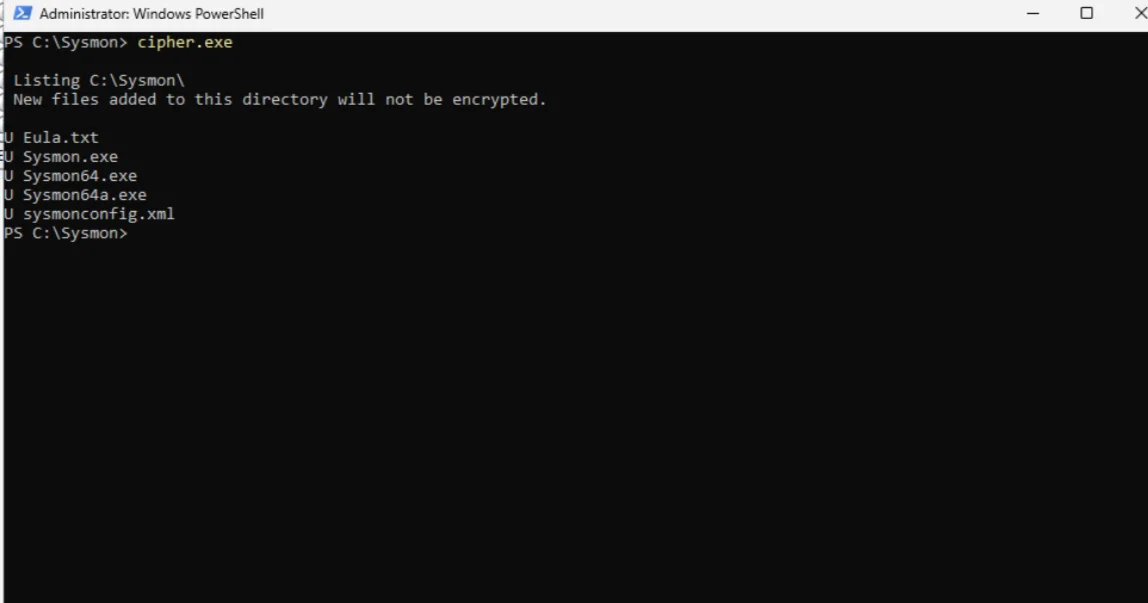
cipher.exe is a default Windows binary. A normal user rarely executes it manually.
That makes it a strong candidate for monitoring.
Method 1: Creating Custom Detection Rules in Wazuh
I moved over to the Wazuh Manager running on the Raspberry Pi.
SSH’d into the manager and navigated to:
1
cd /var/ossec/etc/rules
Then I created a cipher_rule.xml file:
1
sudo nano cipher_rule.xml
Paste this in the editor:
1
2
3
4
5
6
7
<group name="windows,sysmon,cipher">
  <rule id="100100" level="13">
    <if_sid>61603</if_sid>
    <field name="win.eventdata.image" type="pcre2">(?i)\\cipher\.exe$</field>
    <description>Test cipher execution detection</description>
  </rule>
</group>
Important: The if_sid is the ID associated with the
Process creationevent
To find this go Rules > Search Sysmon
Find the ID for Process creation
1
2
3
4
CTRL + X
Y
ENTER
ENTER
Restart Wazuh Manager
After modifying rules:
sudo systemctl restart wazuh-manager
OR
1
Restart-Service WazuhSvc
Give it a few seconds to restart.
Method 2: Managing Rules from the Wazuh Dashboard (No SSH Required)
You can also manage custom rules directly from the Wazuh Dashboard if:
- You don’t have direct SSH access to the manager
- You don’t feel like logging into the Raspberry Pi
- You just prefer using the web UI
Navigate to:
Wazuh Dashboard > Sever Manager > Rules > Manage rule files
From here you can:
- View existing rule files (like
local_rules.xml) - See their respective file paths
- Edit rules directly in the browser
- Add a new rules file
- Import your own XML rules file
- Export formatted rules
This makes rule management much easier, especially in lab environments when you need a quick edit since you can restart the node afterwards without using the CLI.
If you click on local_rules.xml, you can edit it or create rules the same way we did via SSH, just through the web interface instead.
Building Custom Detection Rules
Now that rule management is accessible from both SSH and the dashboard, I wanted to make this lab more operational.
Up to this point, Wazuh has been running with its default rule set.
But default rules only get you so far.
In the next section, I go over how I went about creating a custom detection rule, specifically targeting the execution of cipher.exe, so we can see how to:
- Hook into an existing event (like Sysmon process creation)
- Create a high-severity alert
- Restart the manager
- Trigger the detection intentionally
- Validate it inside Threat Hunting
Creating a Rule for Cipher.exe Execution
Open the Wazuh Dashboard > Rules > Manage rule files
Add new rules file
- File name: cipher_rule.xml
1
2
3
4
5
6
7
<group name="windows,sysmon,cipher">
  <rule id="100100" level="13">
    <if_sid>61603</if_sid>
    <field name="win.eventdata.image" type="pcre2">(?i)\\cipher\.exe$</field>
    <description>Test cipher execution detection</description>
  </rule>
</group>
The if_sid is the ID associated with the
Process creationevent [!IMPORTANT]
To find this go Rules > Search Sysmon
Find the ID for Process creation
Click Save
There will be a message Changes will not take effect until a restart is performed.
Click Restart
Testing the Detection
Now return to your Windows Server and execute:
1
cipher.exe
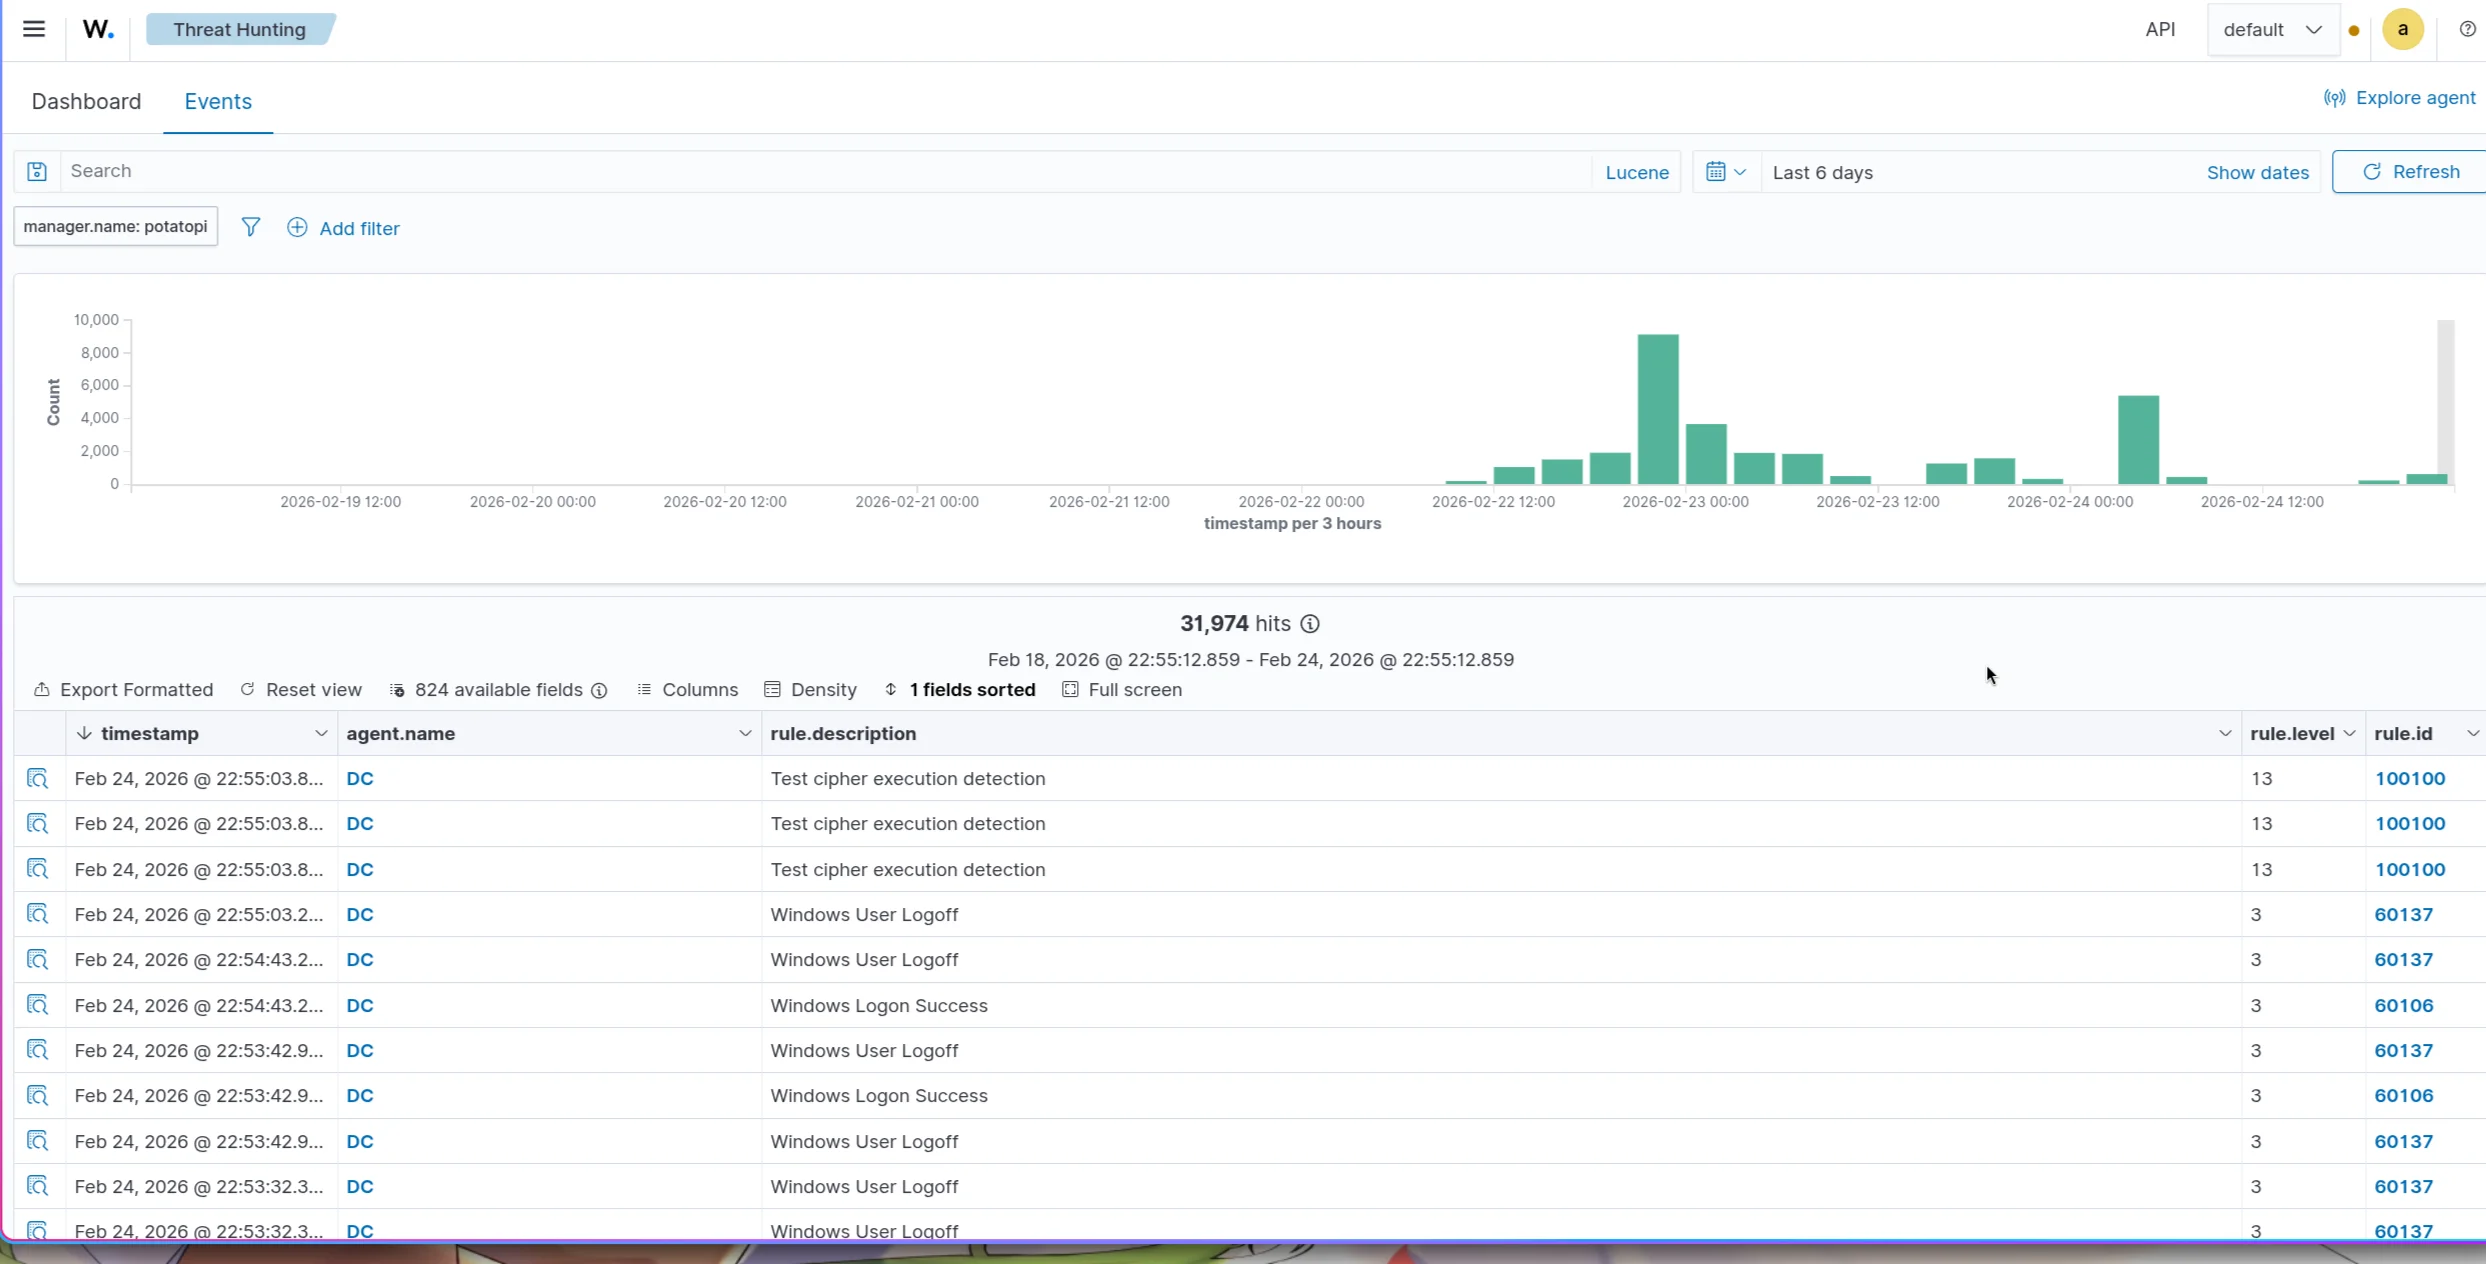
Then check:
Wazuh Dashboard > Threat Hunting > Events
You should see your custom rule fire!
You can make all kinds of rules using these steps! It’s pretty sweet the amount of tools we have access to for logging types of activity.
Lessons Learned
Installing Sysmon completely changed how I view Windows logging.
Before this, I thought Wazuh was “good enough” out of the box. But once Sysmon was feeding process creation events with command-line arguments and parent-child relationships, the difference was obvious.
The logs went from basic authentication noise to actual behavioral telemetry.
A few things stood out during this build:
- Running PowerShell as Administrator matters (learned that the hard way)
- The
if_sidfield is critical, if you hook into the wrong event ID, nothing fires - Restarting the Wazuh manager is required for rule changes (forget that a few times)
- Small test cases like
cipher.exeare perfect for validating detection logic - Visibility > assumptions
I also realized how important it is to understand what “normal” looks like in your environment. cipher.exe might be rare in a normal user workflow, which makes it a strong detection candidate.
But in some environments, it might not be suspicious at all. Context matters.
If it’s not broken, fix it til it is.