Deploying Wazuh in My Homelab (Raspberry Pi + Windows DC)
Deploying Wazuh in My Homelab (Raspberry Pi + Windows DC)
I had never worked with a SIEM before, so instead of just reading about one, I decided to build it myself.
I wanted visual visibility into what was happening inside my lab. Not scrolling through individual logs line by line, but seeing activity patterns form in real time.
I wanted everything in one place.
So I deployed:
- Wazuh Manager + Dashboard on a Raspberry Pi
- Windows Server 2025 (Domain Controller) as an agent
- Tailscale for secure remote access
This is what actually worked - including the parts that almost broke me.
Lab Environment
- Raspberry Pi 4 (8GB)
- Ubuntu Server 22.04 LTS
- Windows Server 2025 (Domain Controller)
- Tailscale mesh networking
- LAN (192.168.x.x)
- Tailscale (100.x.x.x)
Ports Used
- 1514/tcp - Agent communication
- 1515/tcp - Agent enrollment
- 443/tcp - Dashboard access
The First Attempt (Ubuntu 24.04)
I originally installed Ubuntu Server 24.04.
Wazuh failed during installation due to dependency issues (debhelper errors). Instead of fighting package conflicts, I reflashed to Ubuntu 22.04 LTS. > [!IMPORTANT]
DO NOT install Ubuntu 24.04 LTS.
After reflashing the correct OS (Ubuntu 22.04), the installation worked cleanly.
Lesson learned: the newest is NOT always the best. OS versions don’t always play nice with security stacks apparently.
Installing Wazuh on the Pi
First, I updated the system:
1
2
sudo apt update
sudo apt upgrade -y
Then installed Wazuh:
1
2
curl -sO https://packages.wazuh.com/4.14/wazuh-install.sh
sudo bash ./wazuh-install.sh -a
Important: Default Web UI Credentials
At the end of the installation, Wazuh prints the dashboard credentials:
1
2
3
4
--- Wazuh dashboard ---
User: admin
Password: <randomly-generated-password>
Installation finished.
I had to save this password immediately as it only shows once.
I logged in at:
1
https://<my-pi-ip>
- Username: admin
- Password: (generated during install)
After logging in, I changed the password to something easier to remember but still strong.
Dashboard Wouldn’t Load (Service-Level Debugging)
After installation, the dashboard didn’t load at first.
Here’s what I had to check.
1. Verify Wazuh Manager Is Running
1
sudo systemctl status wazuh-manager
Confirmed services started:
- wazuh-analysisd
- wazuh-remoted
- wazuh-logcollector
- wazuh-modulesd
If the manager isn’t fully running, nothing works.
2. Confirm wazuh-authd Is Enabled
In:
1
/var/ossec/etc/ossec.conf
Make sure:
1
2
3
4
<auth>
  <disabled>no</disabled>
  <port>1515</port>
</auth>
3. Fix Dashboard Binding + SSL
In:
1
/etc/wazuh-dashboard/opensearch_dashboards.yml
Confirm:
1
2
3
server.host: 0.0.0.0
server.port: 443
server.ssl.enabled: true
And verify certificate paths:
1
2
3
server.ssl.key: "/etc/wazuh-dashboard/certs/wazuh-dashboard-key.pem"
server.ssl.certificate: "/etc/wazuh-dashboard/certs/wazuh-dashboard.pem"
opensearch.ssl.certificateAuthorities: ["/etc/wazuh-dashboard/certs/root-ca.pem"]
Restart services:
1
2
sudo systemctl restart wazuh-manager
sudo systemctl restart wazuh-dashboard
After that, the dashboard should load fine!
For me, I had more trouble which I include below.
Accessing the Dashboard
It was use either:
- https://192.168.x.x (LAN)
- https://100.x.x.x (Tailscale)
If using Tailscale, make sure you use the Pi’s Tailscale IP as thats where I messed up. It was a long day :)
Using the wrong interface caused connection failures earlier. So I’m guessing I didn’t have to confirm and verify everything before, but it never hurts right?
Since I am using Tailscale I was using the wrong IP to access the web dashboard. Silly me.
Installing the Windows Agent (Domain Controller)
I made a full Domain Controller setup here which I will be using in this setup:
Building an Active Directory Homelab
From the dashboard:
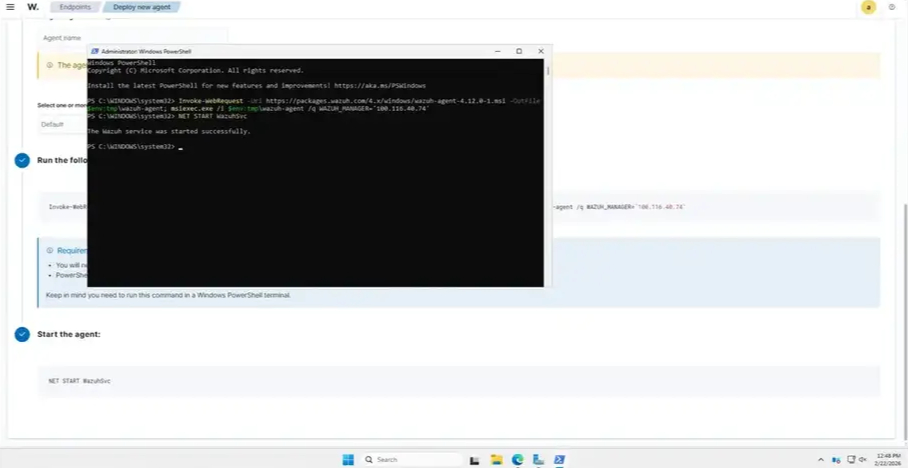
Endpoints > Deploy new agent > Windows
On the Domain Controller I ran powershell as Administrator.
1
msiexec.exe /i wazuh-agent.msi /q WAZUH_MANAGER="100.xxx.xxx.xxx"
I’m using Tailscale so I had to use that IP, not the LAN IP.
Started the service:
1
NET START WazuhSvc
The Wazuh service started successfully and immediately began connecting to the manager.
Verifying the Agent Connection
To verify the Agent is working I ran:
1
Get-Content "C:\Program Files (x86)\ossec-agent\ossec.log" -Tail 20
Now I could see it connect on port 1514.
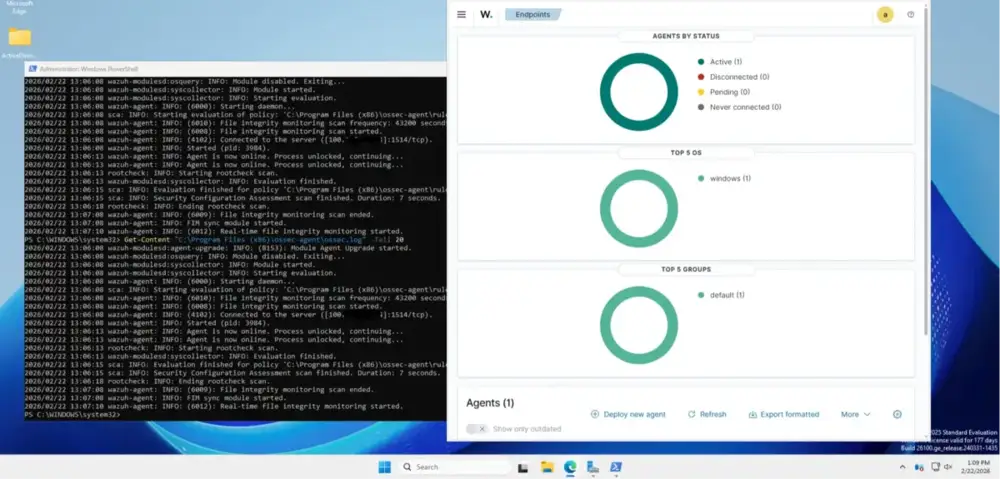
Now in the dashboard:
Agents > Explore Agent Status: Active
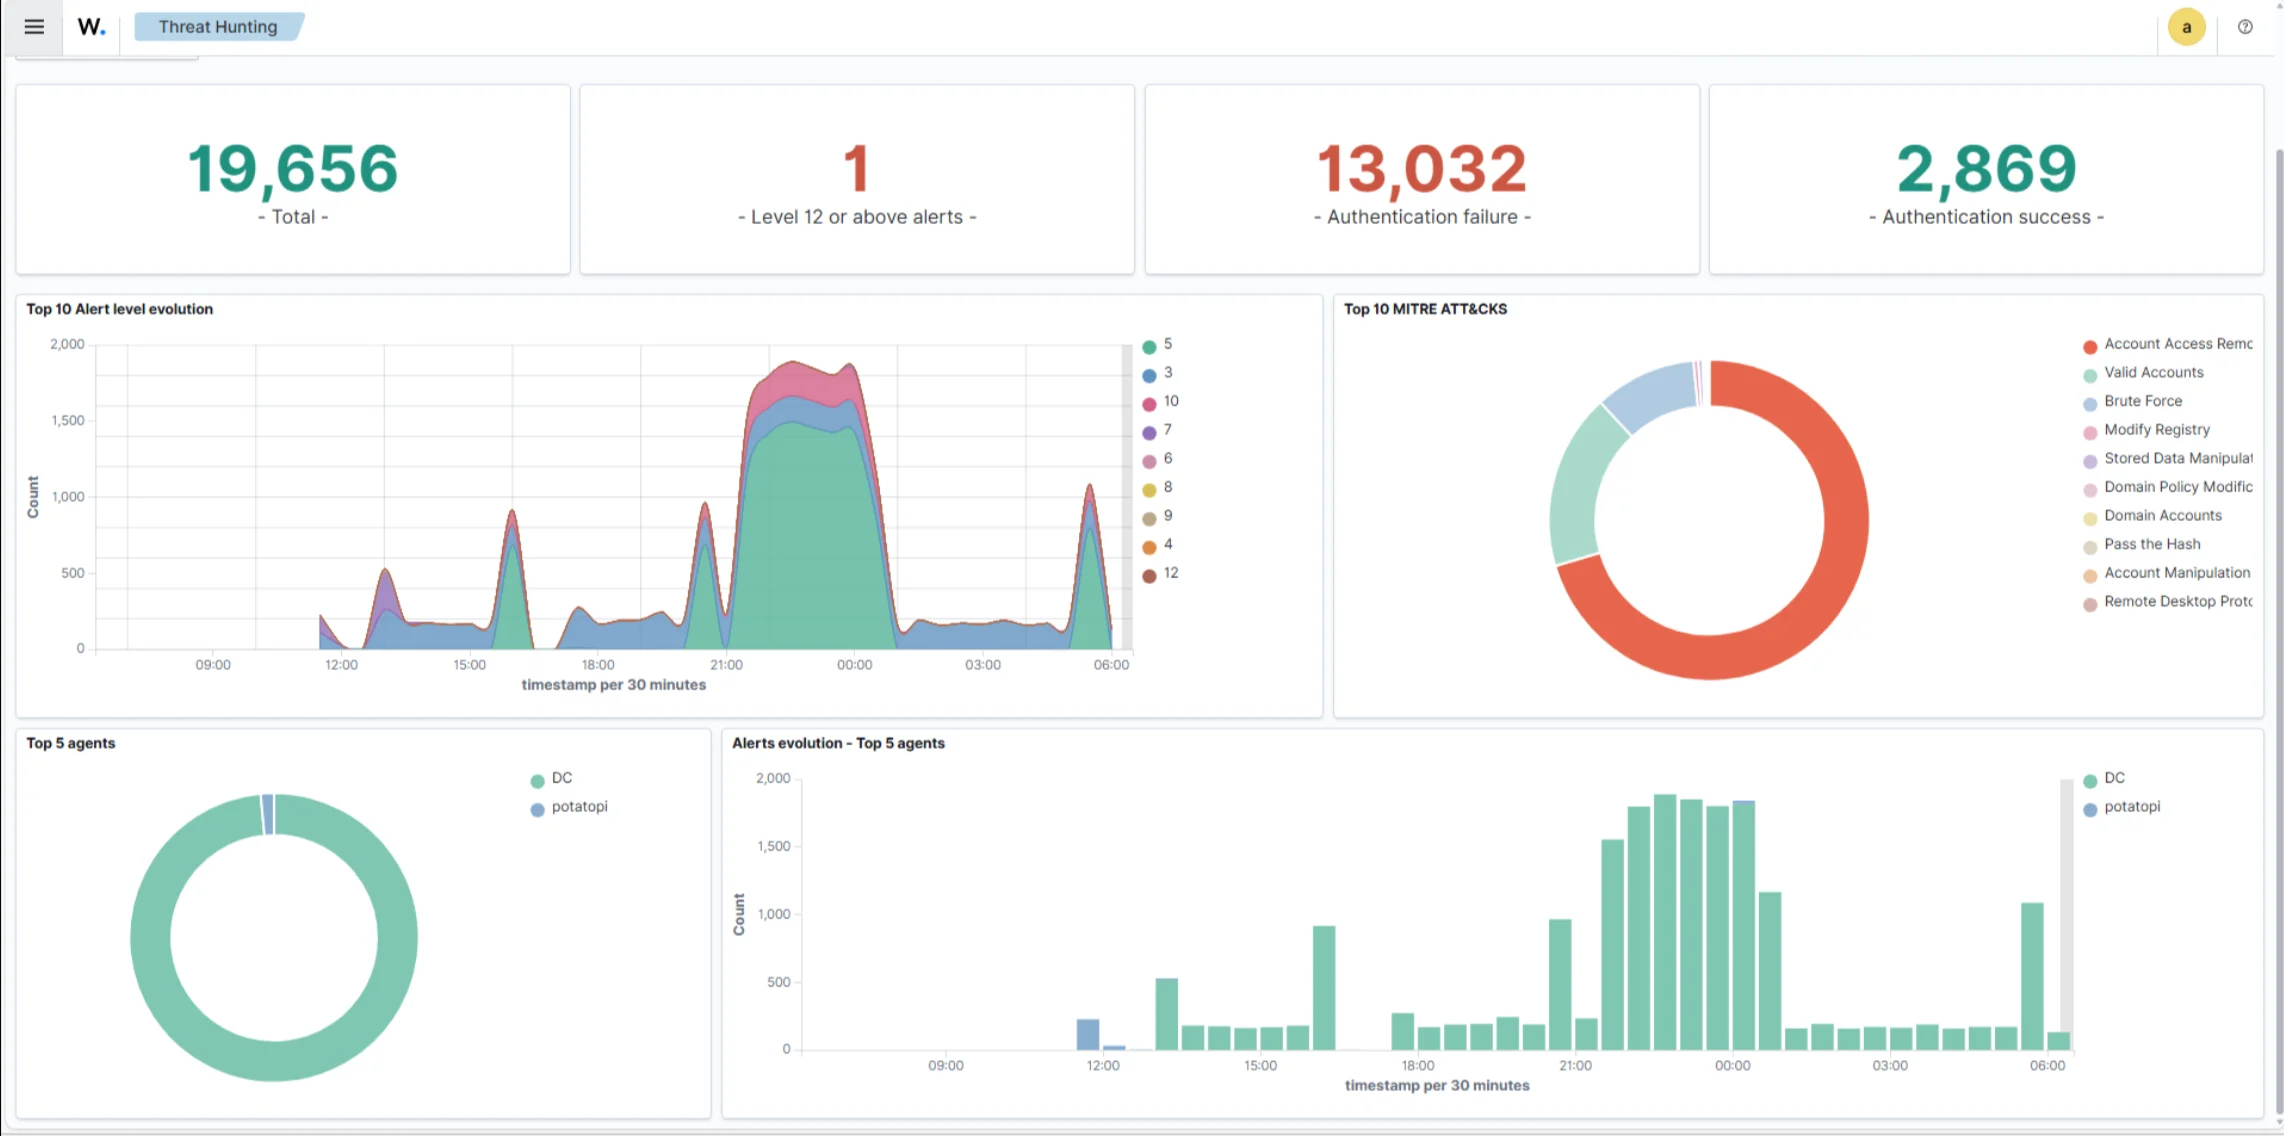
Alerts started to populate under Threat Hunting.
The agent shows as Active and connected to the manager.
What Wazuh Is Actually Monitoring
Wazuh does not automatically monitor your entire network.
It monitors:
- Systems with agents installed
- Logs explicitly forwarded to it
Since only my Domain Controller has the agent installed, alerts currently include:
- Windows authentication events
- File integrity monitoring
- Security configuration checks
- System inventory data
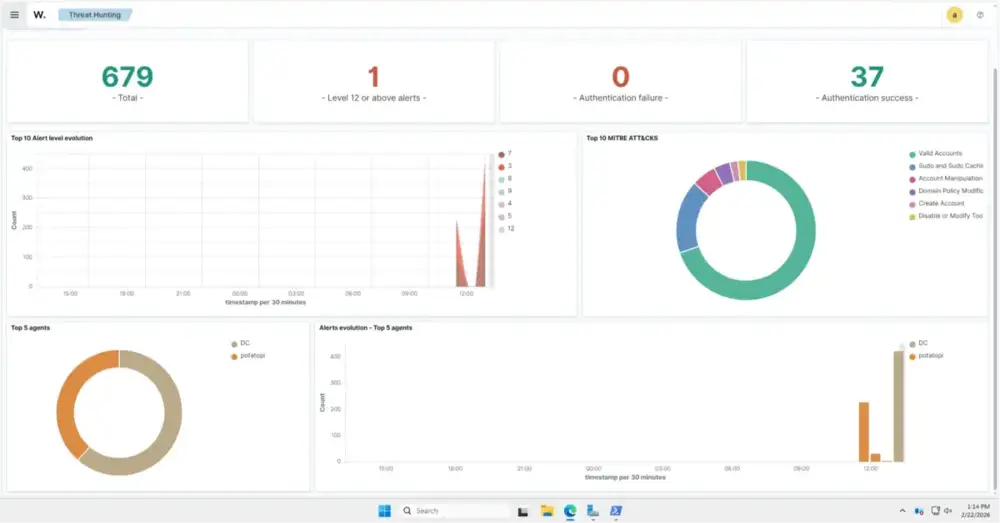
Once the agent was online, alerts immediately began populating in Threat Hunting.
Why This Lab Feels Different
Before this, I was just launching tools. I never got the chance to see what it would look like on the Blue side of things.
Now I have:
- Centralized logging
- Endpoint visibility
- Real alerts
- A foundation for blue team testing
This is the first time my homelab feels like a real SOC base instead of random experiments.
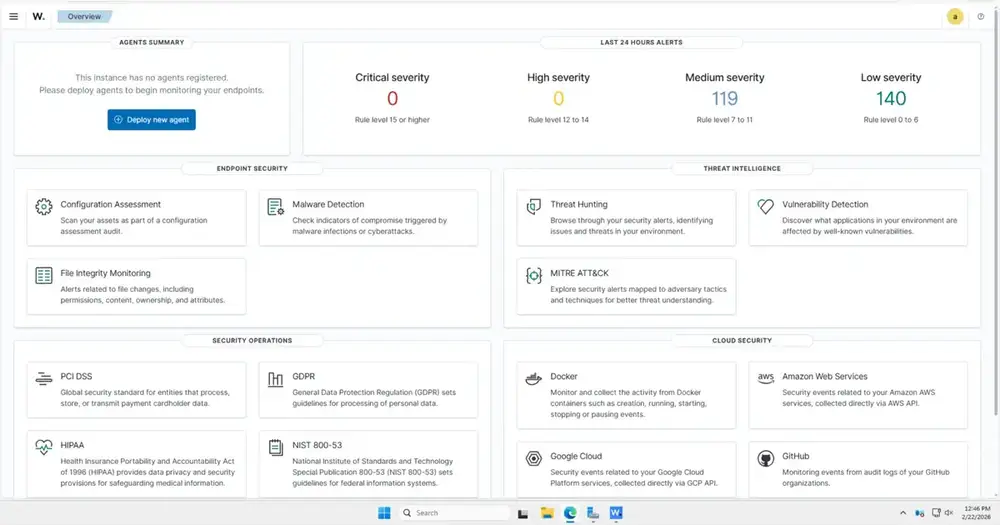
This full Wazuh dashboard gives visibility across configuration assessment, FIM, threat hunting, and vulnerability detection.
Lessons Learned & Takeaways
One of the biggest thing I learned from this build is that the biggest problems are usually a small configuration issue. I did not expect for Ubuntu 24.04 to break the install, since I had already seen other blogs about it working with T-Pot.
The dashboard not loading was a silly mistake since I was using the wrong IP because I was using Tailscale for better network segmentation. Wazuh didn’t magically see everything, which taught me a valuable lesson.
After installing the agents on my Domain controller and watching real authentication logs populate in real time changed how I look at my lab. I have always had random spun up VMs but now I actually have visibility. This made the setup completely worth it.
Next Post:
I found out that there was more to add in order to get full logs in one place. I decided to go with Sysmon for better telemetry.
View the blog post here below!
If it’s not broken, fix it til it is.